Halloween has come and gone but like our staffer who bought enough candy to give out to the number of trick-or-treaters he got before the pandemic, we at Firmographs have an abundance of sweets to share with you.
Our sweets, however, aren’t the confectionery kind. Instead, they’re the nuggets of knowledge that we got by analyzing the blogging habits of the 243 companies that made ENR’s Top 200 Environmental Firms in any of the years from 2018 through 2021.
We did a similar analysis earlier this year in our first Blog o’ Blogs, which looked at the blogs those firms wrote in the first six months of 2021. But now, in our second Blog o’ Blogs, we’ve extended the time frame to the first nine months of the year.
Searching for PFAS
In the first BoB, we looked at water-related terms, including PFAS, the so-called forever chemicals that are raising concerns due to their prevalence in the environment. This time, however, we decided to concentrate on PFAS, looking at how often the term appeared in the blogs we analyzed over the first nine months of the year.
The results of that analysis are displayed in the bar chart below. As you can see, it was a fairly popular term with 907 total mentions. Also, the number of times it was mentioned didn’t vary much by month, with the exception of March, when it was mentioned 222 times.
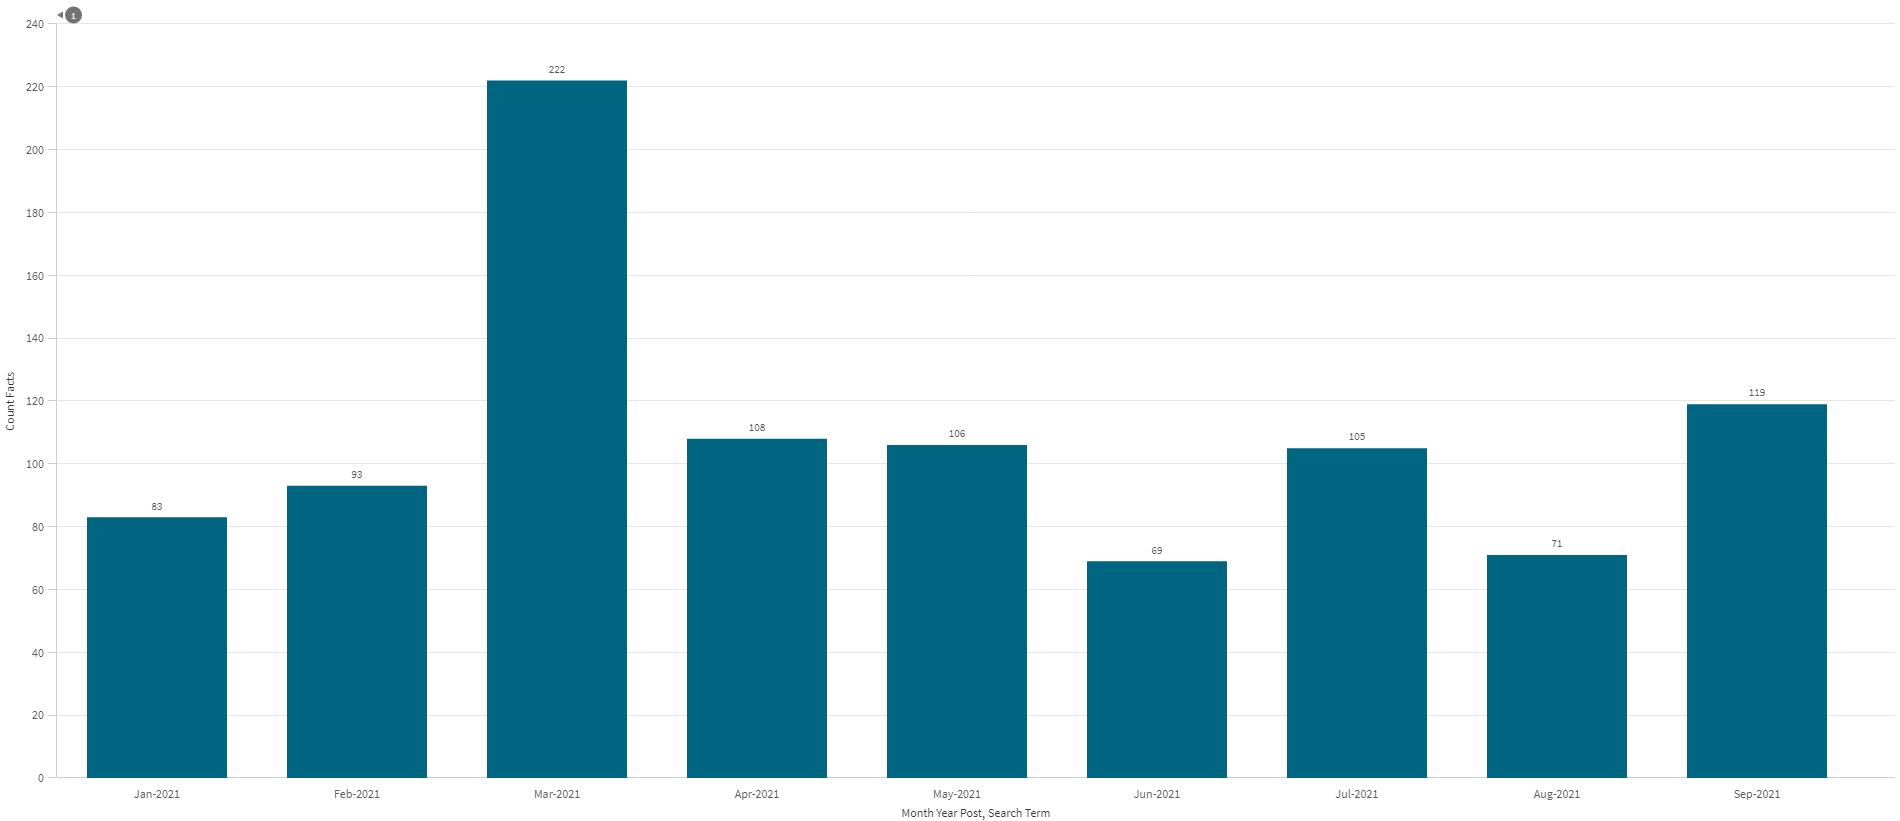
Why the spike? It likely was in response to the Environmental Protection Agency on February 22 issuing two actions meant to address the presence of PFAS in drinking water. The agency reproposed the Fifth Unregulated Contaminant Monitoring Rule to collect new data on PFAS in drinking water and reissued final regulatory determinations for two types of PFAS under the Safe Drinking Water Act.
Another possible reason was that the American Jobs Plan released by the White House on March 31 proposed providing $10 billion to monitor and remediate PFAS in drinking water and to invest in rural small water systems and household well and wastewater systems.
Carbon Dating
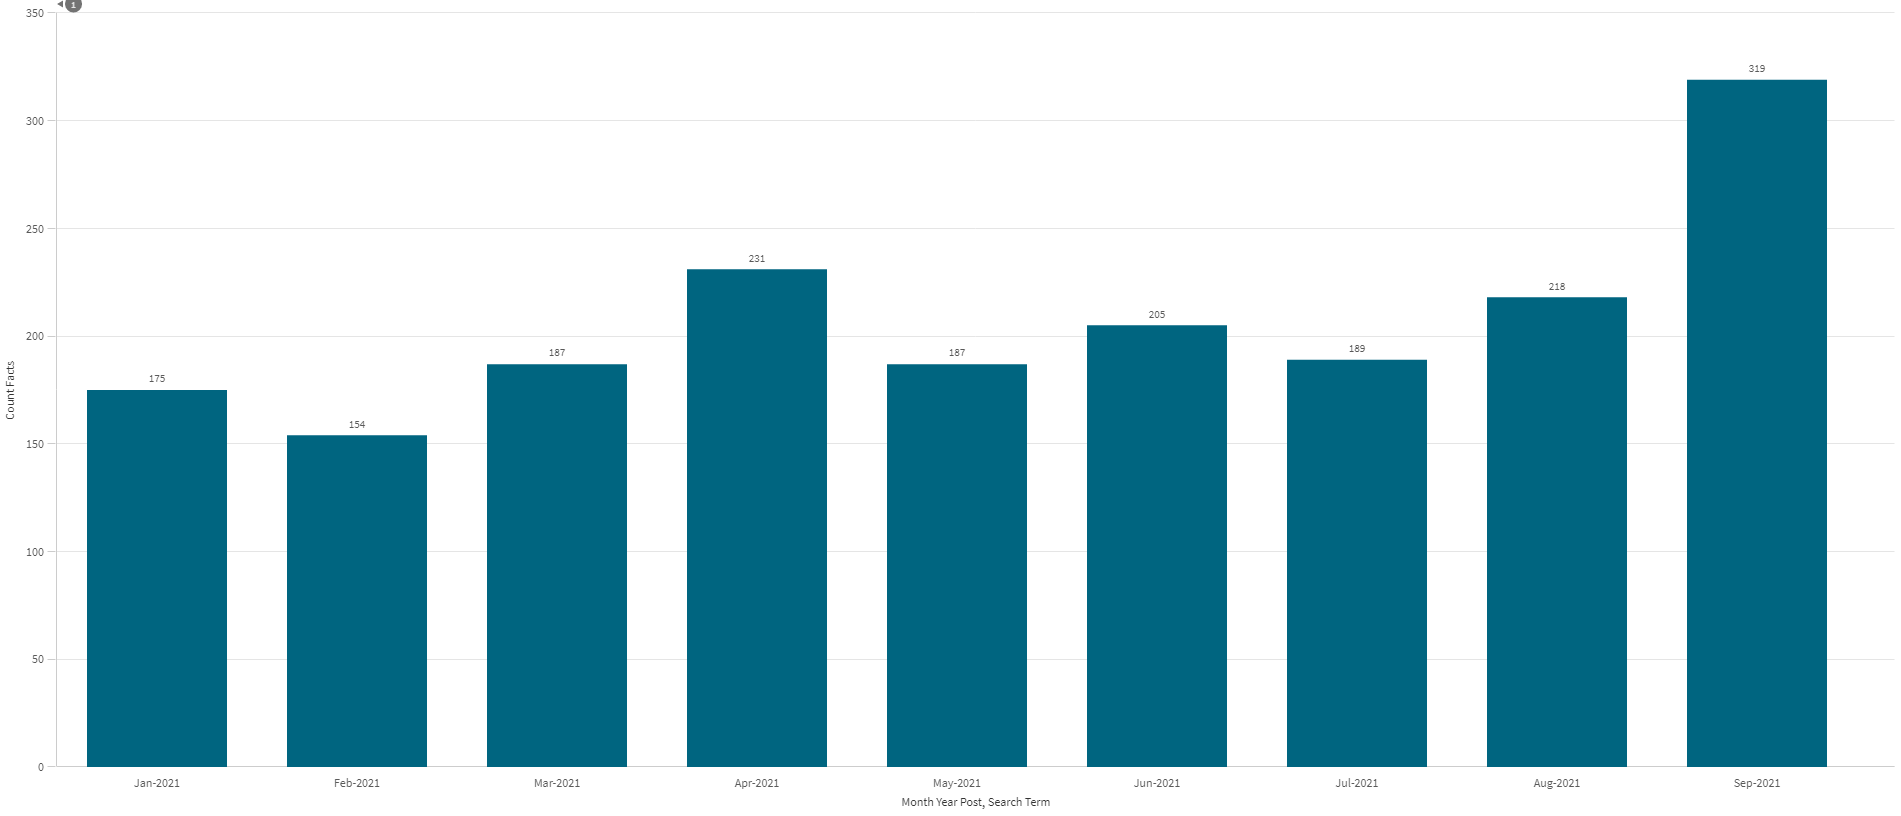
In addition to water, another term we thought might interest our customers is carbon, as the efforts to reduce emissions of it have the potential to produce lots of work for infrastructure companies involved in the electrical transmission and renewable generation markets.
Carbon turned out to be a more popular term than PFAS, appearing 1,736 times in blog posts. And as the bar chart below shows, it, like PFAS, was mentioned a relatively similar number of times each month with one outlier — September, when it appeared 319 times. That spike is likely due to the heating up that month of discussions over the two major spending bills being considered by Congress. Although their substance is still being debated, various incarnations of them have contained proposals designed to limit carbon emissions, including tax credits for renewable generation developers; tax incentives for consumers who buy electric vehicles; and a program designed to reward utilities that get an increasing amount of power from clean generation and penalize those that don’t.
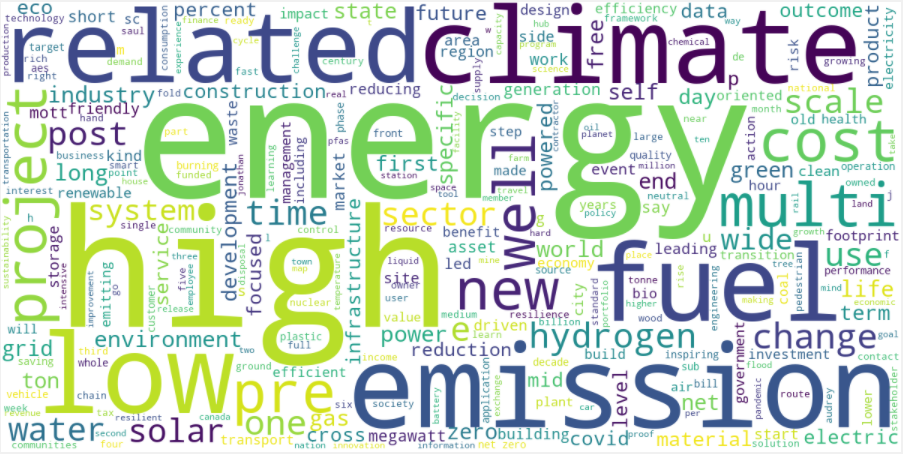
We also did a word cloud of blogs that contained the word carbon. When we removed such common words as “the” and “an,” and, of course, “carbon,” we got the result below, which is about what you’d expect, with words like energy, climate and emission showing up prominently.
Blog Breakdown
As in our first BoB, we looked at blogs written by the 243 companies that made ENR’s Top 200 Environmental Firms in any of the years from 2018 through 2021. This time, however, we had data from the third quarter, which enabled us to extend our analysis from the first six months of the year to the first nine months of the year.
Once again, we divided blog posts into four categories according to their subject matter.
- Qualifications and Staffing posts deal with the capabilities of a firm and/or individual staffers, as well as hires, promotions, and other personnel changes, typically without deep discussion.
- News posts include any type of news about a firm, including M&A, awards, and events.
- Projects posts primarily are about projects done for customers, who usually are identified, but may also mention news or provide some insights.
- Insights posts may mention news or projects but are more in-depth looks at one or more topics that highlight a firm’s subject-matter expertise.
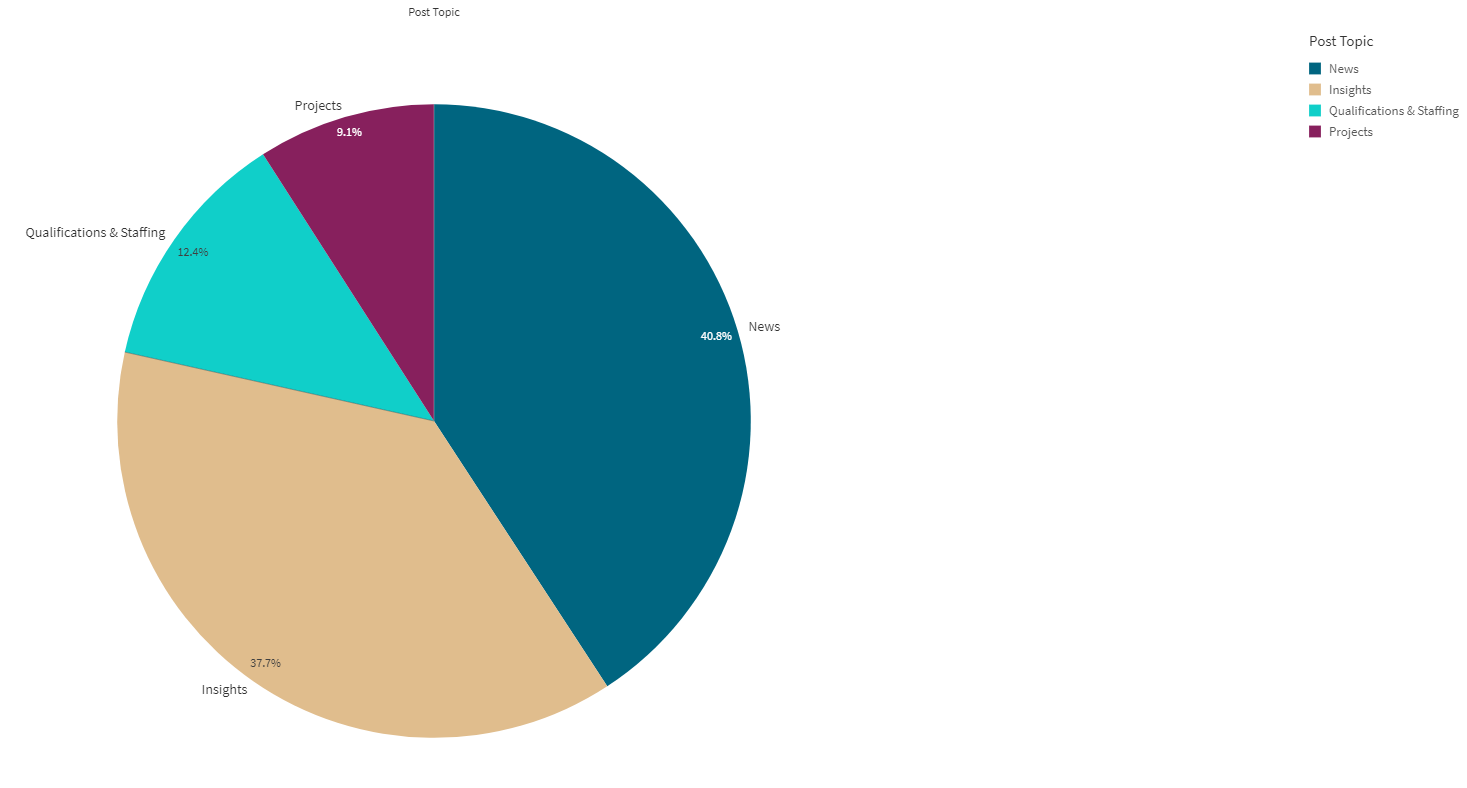
We listed the categories in the order that they ranked for posts. As you can see from the pie chart below this paragraph, through the first three quarters of the year, 41.8%, or 3,946, of the posts by the firms we monitored were News posts; 37.2%, or 3,517, were Insights posts; 12%, or 1,135, were Qualifications & Staffing posts; and 9%, or 845, were Projects posts.
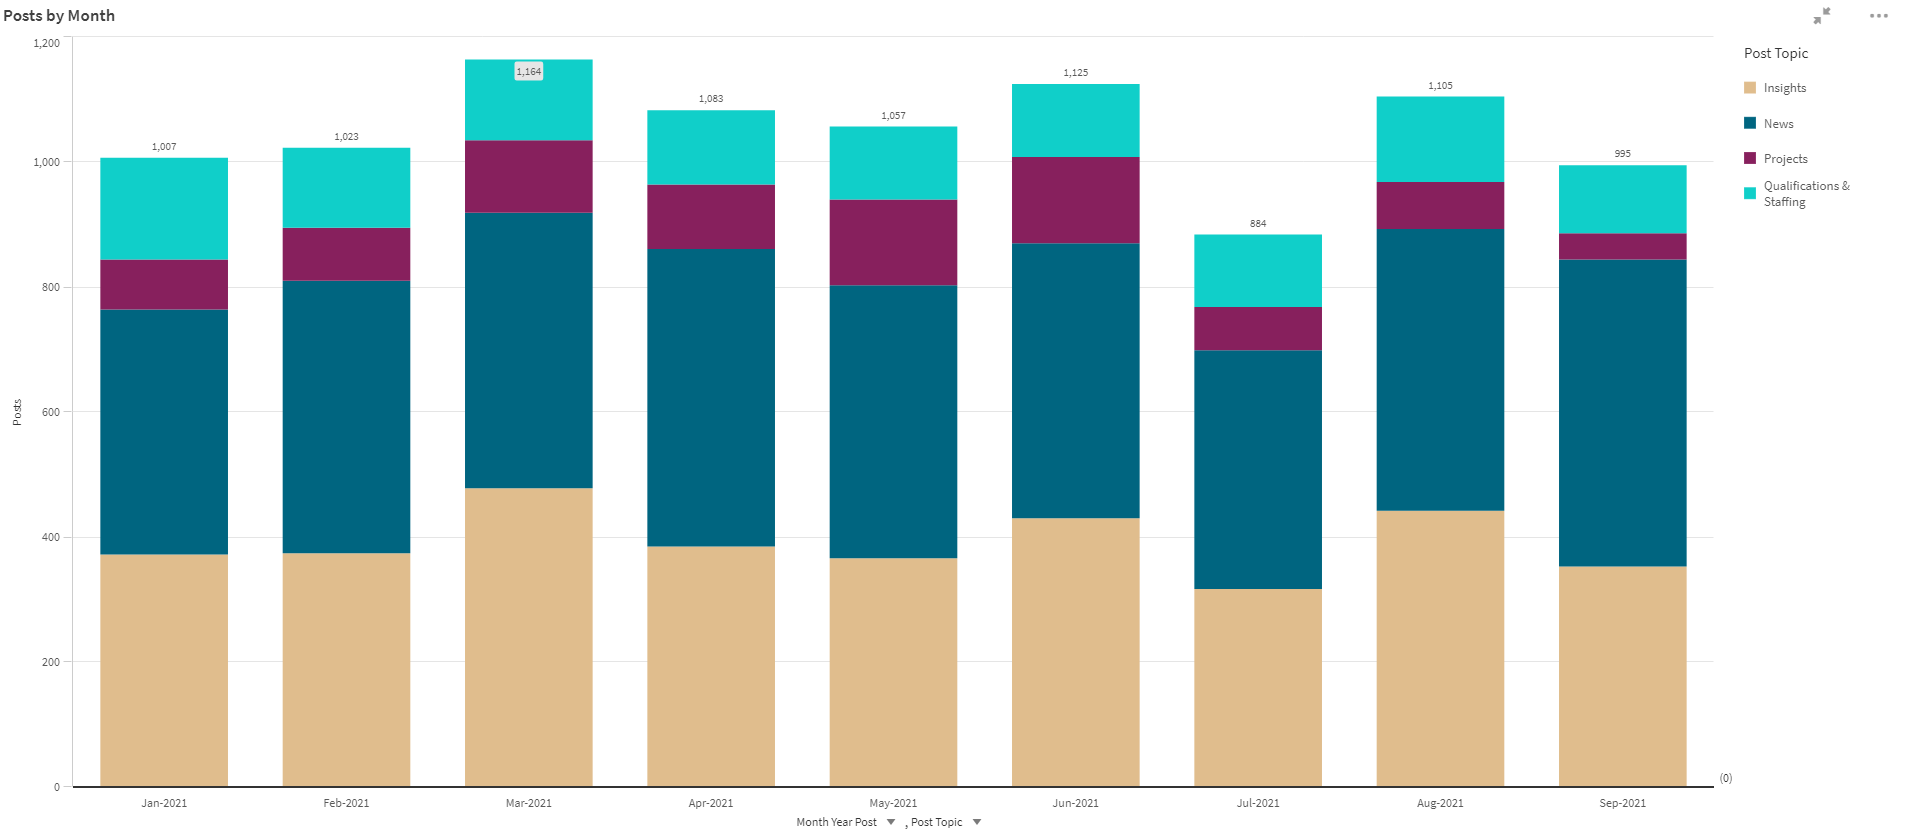
The order is the same as it was after six months. The only difference was that companies had more News posts and fewer Projects posts in the third quarter. In the first six months of the year, 39.3% of the posts were News posts and 10.7% were Projects posts. The bar chart below gives a breakdown of posts by months.
Who is Blogging
To give FirmoGraphs’ customers a sense of how their blogging practices compare to their peers, we categorized the companies we looked at based on the annual revenue of their environmental practices. The following table shows how many companies are in each category, how many blog posts they made in the first three quarters of 2021, and the average and median numbers of posts for each category.
|
Group |
Annual revenue |
Number of companies |
Number of blog posts |
Average # of blog posts |
Median # of blog posts |
|
1 |
< $100 million |
83 |
2771 |
33.4 |
23 |
|
2 |
$100 to $249 million |
37 |
1762 |
47.6 |
38 |
|
3 |
$250 million to $1 billion |
32 |
2478 |
77.4 |
61 |
|
4 |
> $1 billion |
14 |
1795 |
128.2 |
92 |
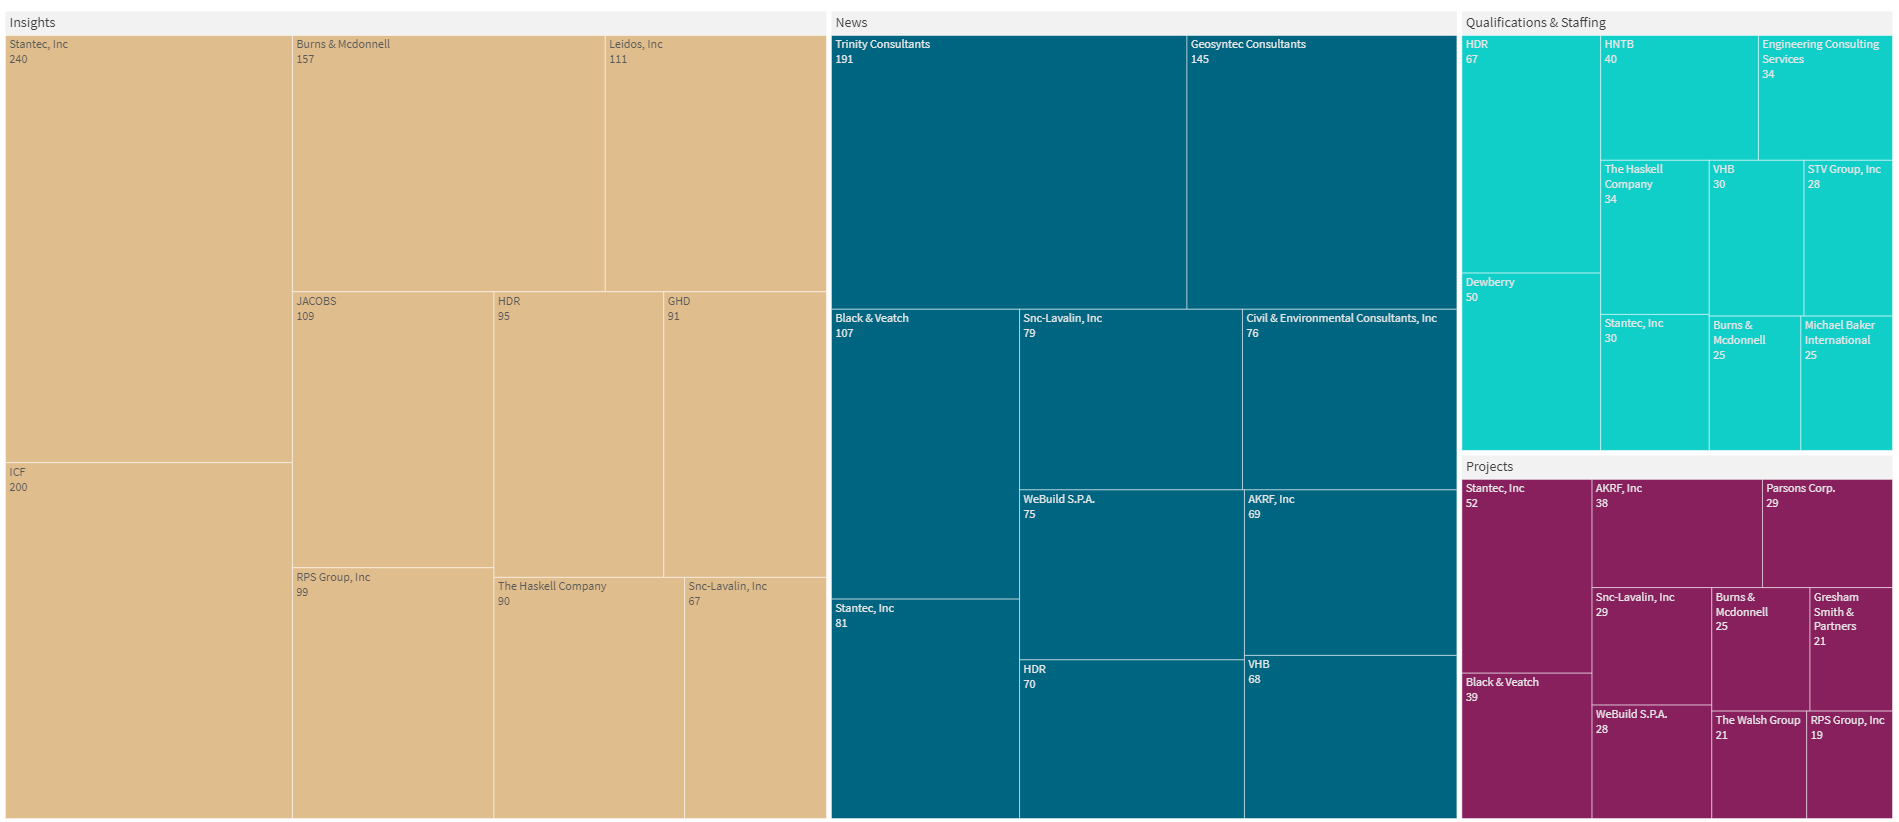
In Group 1 (< $100 million), RPS Group, Inc., with 163 posts, Dewberry (134) and VHB (127) were the most frequent posters. In Group 2 ($100-249 million), Trinity Consultants (211), Haskell Co. (178) and SCS Engineers (131) posted most often. The most frequent posters in Group 3 ($250 million-$1 billion) were ICF (282), Burns & Mcdonnell (234) and SNC-Lavalin Inc. (187). In Group 4 (> $1 billion), Stantec (403), HDR (234) and Black & Veatch (204) posted most often.
It’s not surprising that Group 1 companies have the most posts because there are the most of them. What is surprising, or at least interesting, is that there are 5 more companies in Group 2 than there are in Group 3, yet Group 3 companies made 716 more blog posts in the first three quarters of the year. We think that’s because Group 3 companies have significantly more revenue than Group 2 companies and therefore likely have larger staffs, enabling them to do more blog posts.
We used our preferred business intelligence tool, QlikSense, to create a treemap that shows the Top 10 bloggers in our four revenue categories. This is one of many data visualizations that QlikSense allows us to create and although the type is a little hard to read at this size, we can show you a larger version when we meet.

Let’s Meet
Speaking of meeting, let’s talk about why we should do so.
Although we think this blog is useful to our customers, as it shows how often AEC firms with big environmental practices are blogging, and what they’re blogging about, we also wrote it to show off our abilities to crunch and display data. In addition to blogs, we collect data on infrastructure projects in the transportation, energy, water and environmental remediation sectors that we can help you use to find projects to bid on. If you think we could help your company, feel free to request a meeting and review our data live in our business intelligence platform.
And if you want some sweets, let us know. Apparently, one of our staffers has a cupboard full of them.