2019 has been a big year for climate-related news and the related socio-political movements at home and abroad. Our interests are with the U.S. industrial aspects of the total global emissions picture.
We’re pleased to announce that the Climate Mart™ is now ready for release, based on 2018 mandatory reporting submittals to the EPA. Climate Mart™ brings together data and insights from Greenhouse Gas (GHG) emissions reported by US companies subject to the EPA mandatory reporting rule.
The Climate Mart is a valuable data repository for service providers and industrial organizations seeking to understand industrial climate emissions. Insights include:
- Multi-year emission trends by industry, region, and organization covering 3,000+ organizations reporting from 7,500+ sites.
- Gases and industrial processes contributing to CO2 emissions expressed as metric tonnes of CO2 equivalent gases.
- Detailed single industry emissions, such as for extractive industries, including details such as oil and gas equipment and production areas.
Looking at Industrial Emission Trends
We’ve invested substantial effort into Climate Mart, consolidating and validating organizational emissions data and providing more than 1200 emissions-related attributes so you can:
- View comprehensive industry and organization emissions’ data through our easy-to-navigate, interactive dashboards.
- Effortlessly create data visualizations through Qlik Sense™ to analyze trends and uncover opportunities. It’s in-memory processing helps you create instant drill-downs and create heat maps, tables, Sankey diagrams and more.
- Integrate our data with your proprietary information to benchmark planned mandatory GHG reporting against peer organizations ahead of the 2019 reporting season.
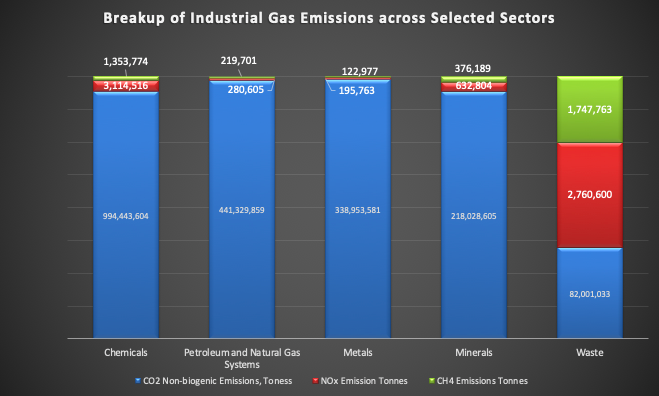
An item of interest is the contribution of different greenhouse gas types. The primary gases reported are carbon dioxide (CO2), methane (CH4) and nitrous oxide (N2O). These differ in their global warming potential (GWP).
As the primary greenhouse gas and reference, CO2 has a GWP of 1. In 2017, CO2 accounted for about 81.6 percent of all U.S. greenhouse gas emissions from human activities. CO2 emissions cause increases in its atmospheric concentrations that will last thousands of years.
Then, consider methane (CH4): While CH4’s lifetime in the atmosphere is much shorter than CO2, CH4 is more efficient at trapping radiation than CO2. Yet, CH4 is pound for pound, more than 25 times more efficient at trapping radiation than CO2 over a 100-year period thereby having a higher global warming potential.
Finally, N2O has a GWP 265–298 times that of CO2 for a 100-year timescale. N2O emitted today remains in the atmosphere for more than 100 years, on average.
The following chart shows the distribution of emissions, normalized to 100%, for five of the top emitting U.S. sectors, excluding power plant emissions.
1https://www.epa.gov/ghgemissions/overview-greenhouse-gases
Understanding the Reporting Burden
Data from the Climate Mart™ 2019 Release shows us that organizations in the Power Generation, Landfill, and Oil and Gas industries bear the highest reporting burden when it comes to reporting GHG emissions.
By reporting burden, we mean the number of sites that are required to report, the number of states those sites are located in, and the number of reporting sub-parts the sites are subject to. Leading organizations in these industries have operations spread out over many states.
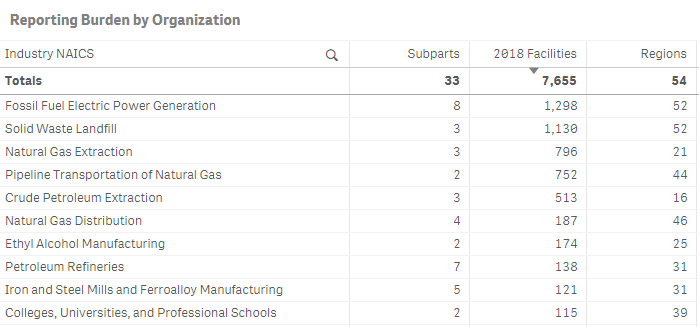
As a service provider of GHG emissions consulting and reporting services, understanding the reporting challenges faced by your customers may help you get ahead in your business development and account targeting activities.
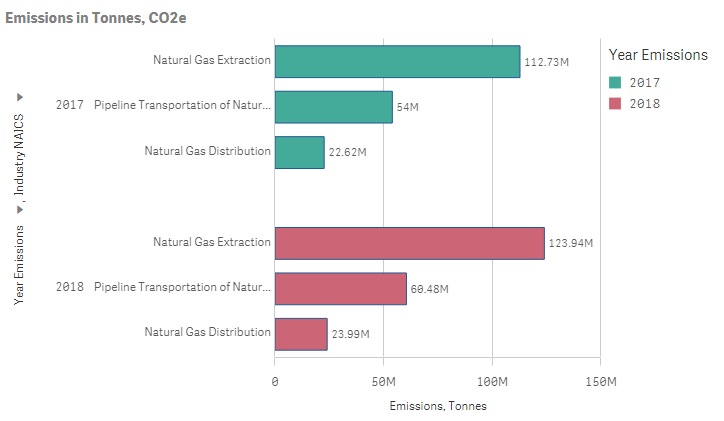
Diving Deeper on the Natural Gas industry
Climate Mart includes emissions data from the following Natural Gas industry codes: Natural Gas Distribution, Natural Gas Extraction and Pipeline Transportation of Natural Gas. These industries reported an increase in CO2e emissions from 2017 to 2018, as gas production soared by 11.5 percent in the United States.
Also of interest is the contribution of these industries by gas. It is interesting that with the large increase in total gas production, there was relatively little change in the amount of CH4 emissions, indicating that a close eye is being kept on emissions of uncombusted methane.
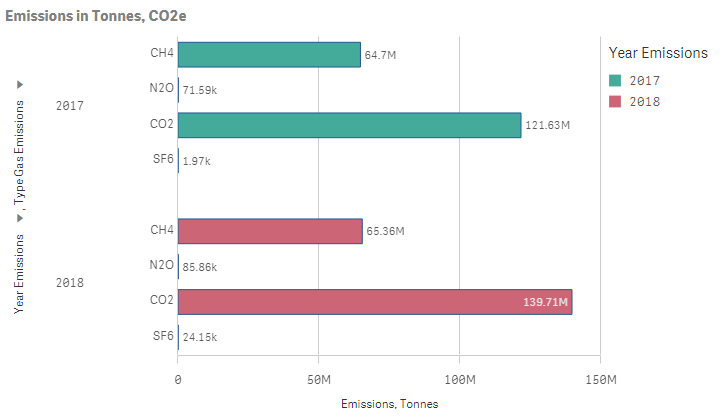
While the contribution of the natural gas industry to total emissions is relatively small, the natural gas industries have strong incentives to reduce emissions. Every molecule of CH4 that is emitted represents lost revenue. The EPA’s Natural Gas STAR Program helps partner companies implement methane reducing technologies and practices. They document and share their progress with voluntary emission reduction techniques across the organization and with the Natural GAS STAR program.
EPA Gas Star Collaboration with Huco Consulting
In July’s Gas STAR webinar hosted by the EPA, FirmoGraphs co-delivered a presentation with Huco Consulting and Kinder Morgan on using GHG emissions data and analytics to optimize operations and reduce emissions. As a follow-on, the 2019 Natural Gas STAR & Methane Challenge Fall Workshop was held in Pittsburgh, Pennsylvania from November 4-6, 2019. Participants attended to learn about innovative approaches to voluntarily methane emissions reduction.
Ron Huijsman, Huco Consulting Founding Partner, shares that “It was exciting to see so many new companies partnering with the EPA this year to participate in the STAR and Methane Challenge Initiatives. This year, there were a variety of new presentation topics, and we were proud to be selected by the EPA to present on the work we have been doing with FirmoGraphs. We believe that helping companies use data effectively will give greater insight to both operations and environmental departments which will allow organizations to more easily identify areas where they can make improvements and in turn, lower methane emissions.”
To learn how our climate data and visualizations empower you to provide better GHG-related services, read our blog posts here. At FirmoGraphs, we help you run the race just a bit faster, and sometimes, that is all you need. Contact us today.
Disclaimer
None of the information we provide may be taken as legal advice. Please consult an attorney if you require a legal interpretation of this information.
Any information contained on this website or within any attachments is offered without representation or warranty as to its accuracy or completeness and FirmoGraphs, LLC cannot be held responsible for loss or damage caused by errors, omission, misprints or your misinterpretation of such information. Seek competent professional advice prior to relying on or utilizing such information in any manner as any such use is at your own risk.

