FirmoGraphs is delighted to announce the current release of the Finance Mart. Finance Mart is a carefully designed dataset that provides well-structured information and insight to the financial performance of the publicly listed companies on US Stock Exchange. This data mart is presented in a business intelligence format, adding value to analysis of sophisticated business managers and marketers.
As obliged by the SEC, companies traded on US stock exchanges are required to provide quarterly (8-k) and yearly (10-k) Financial reports which may be extensive and detailed, carrying a wide array of information about the business.
Understanding the need and requirements of the market, Firmographs, not only saves time but adds value to your analysis. By gathering financial data from over 5000 reports and formulating it into material insights, Firmographs empowers your analysis and business understanding, adding value to your decision making.
For this release, Finance mart is packed with data spanning over the last five quarters (Q1, Q2, Q3 and Q4 of 2018 as well as Q1 of 2019).
About the 10-K Reporters
number of reporters by industry
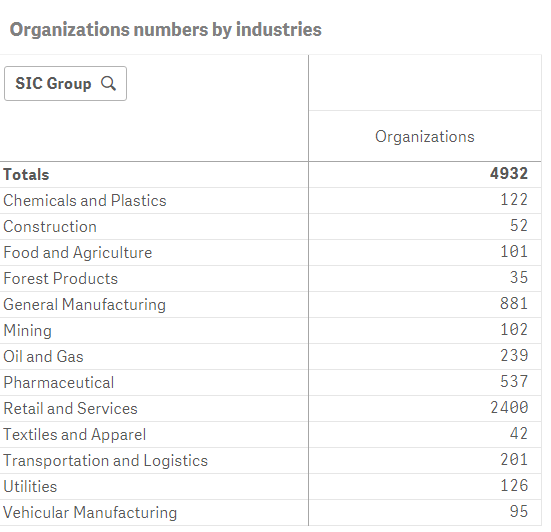
Finance mart is a comprehensive representation of a wide range of dataset, something that will be brought up during the course of this blog. Finance Mart incorporates a total of 15 industries, each including a large number of industry-specific companies. The dataset, at such a large scale, provides the opportunity for us to evaluate and compare the companies within and in cross relation to different industries. A total of 5000 publicly traded companies make up this dataset. With the obligation of companies to provide annual reports, Firmographs acts in an efficient manner to gather all the released information and accurately transferring the necessary analysis and insights.
Shown below is a table containing a list of all industries covered by the Finance Mart and the number of companies classified in each of them.
Industry Focus
At FirmoGraphs, we are focused but not limited to heavy industries; such as utilities, manufacturing, oil and gas, mining, and construction. It is worth mentioning that NYSE and Nasdaq combined have around 5000 companies listed on their markets).
With that said, we would like to take a moment to present the potential of the Finance mart by showcasing a sample of our analytics relating to the heavy industries. It is important to note, Finance Mart implements a well-structured classification thereby relating each company to one of the respective 15 industries.
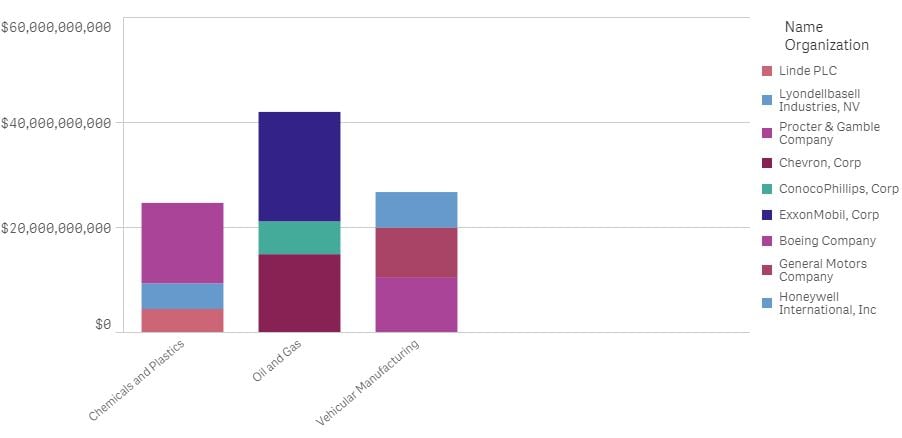
Top 3 companies by net income within an industry
Let’s start with a relatively obvious sample data; the Net Income. Net Income can be easily found in the Profit and Loss Statement of a company. Although, it is irrelevant to compare cross-industry Net Incomes, it is critical in analyzing the company performances within an industry. Here shown are the top 3 performers in terms of net income in three selected industries.
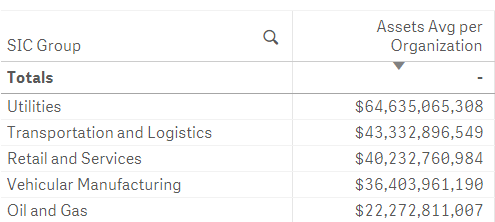
Average asset value per company in different industries and their capital intensity ratios
The capital intensity ratio carries specific interest for the analysts. It can be calculated by dividing Total Assets by Sales figure. In simpler terms, it calculates the amount of assets necessary to generate revenue of $1. When used in combination with other ratios, it provides the analyst with useful insight about the organization’s business. Shown below are average assets values per company in different industries and average capital intensity ratios. These can also be shown on a company level, as it is shown in the latter table.
Asset Retirement Obligations
As defined by investopedia.org, Asset Retirement Obligations (ARO further in the paragraph) refer to the retirement of a tangible long-lived asset that depends on a future event beyond the an obligated party’s control.
An asset may be considered retired, if it is no longer operational e.g. sale or disposal of long lived assets. The accounting of such assets to its original state is necessary for standard of accounting as well as a legal obligation. It is important to note; the ARO cannot be applied to the work done for or costs associated with accidents cleanups or disasters.
Among common examples of AROs, Deloitte name the following in their ARO roadmap:
- Landfill closure and postclosure care
- Mine reclamation
- Nuclear decommissioning
- Oil well plugging and abandonment
- Abatement of asbestos-containing materials
- Underground storage tank removal.
The Environment Remediation Liabilities is a Balance Sheet component which was adopted as a result of federal, state or local environmental regulations. It defines the maximum level contamination level for a specific company before necessary remedial actions are required.
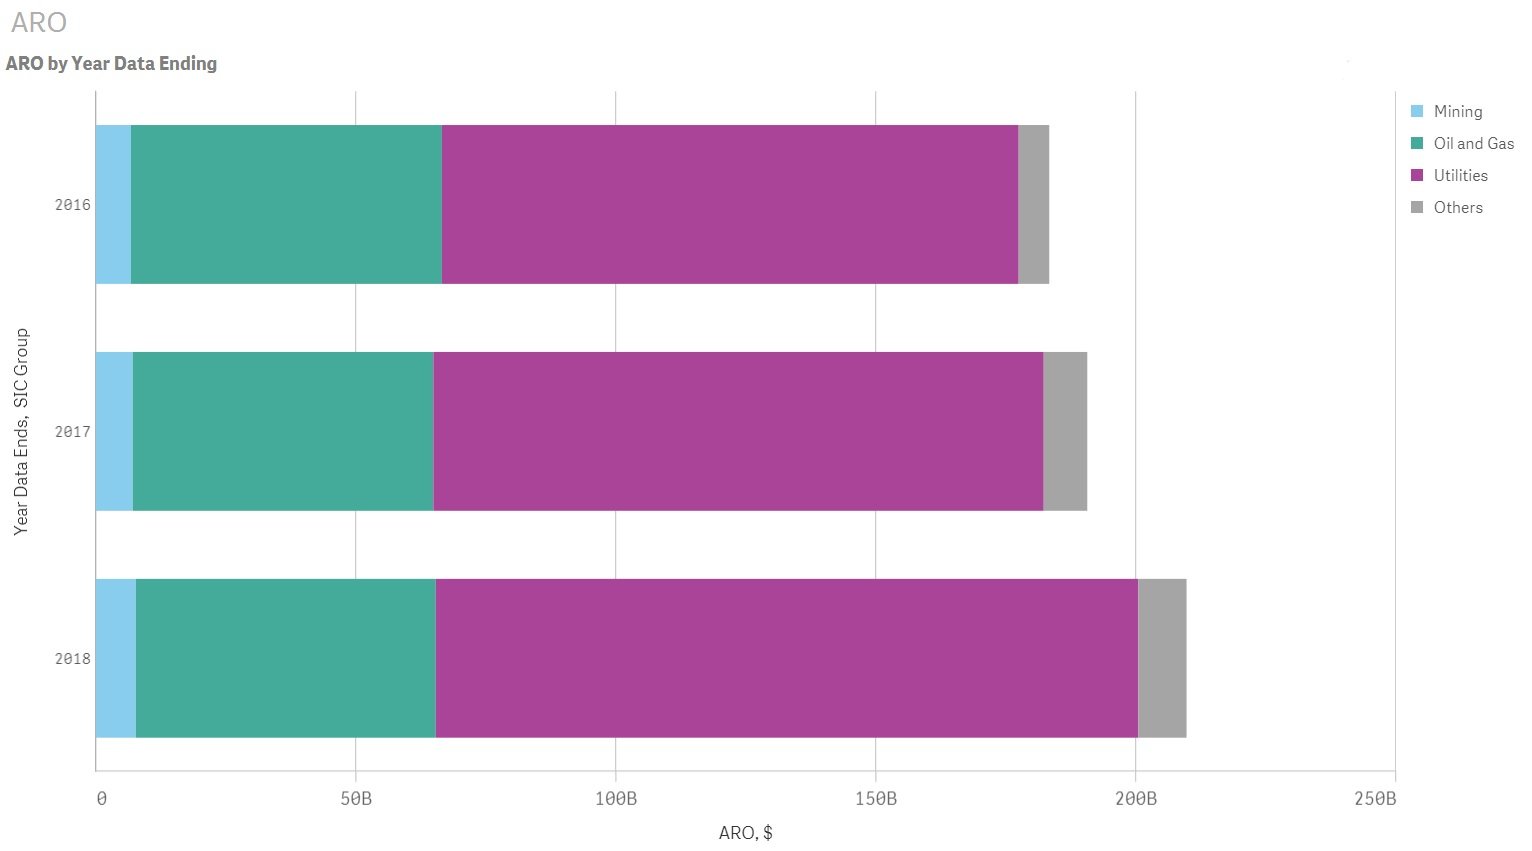
It is interesting to note in the following table the utility industry increase of AROs over the last 3 reporting years, particularly the jump of approximately $20B in Utility AROs from 2017 and 2018 attributed to coal power plant remedial obligations.
Conclusion:

The US Financial Markets, regulated by the SEC, report millions of data values across 1000s of financial performance indicators each year. FirmoGraphs' Finance Mart contains valuable normalized performance indicators for US publicly-traded organizations, updated quarterly for annual results.
The Finance Mart is part of the family of FirmoGraphs data marts, providing critical information and insight related to US utility and industrial markets.
Click below to download our E-Book on 5 Critical Actions you can take to make your marketing more insight-driven, using Business Intelligence.
Disclaimer
None of the information we provide may be taken as legal advice. Please consult an attorney if you require a legal interpretation of this information.
Any information contained on this website or within any attachments is offered without representation or warranty as to its accuracy or completeness and FirmoGraphs, LLC cannot be held responsible for loss or damage caused by errors, omission, misprints or your misinterpretation of such information. Seek competent professional advice prior to relying on or utilizing such information in any manner as any such use is at your own risk.