When it comes to new generation projects, the approval process strongly influences project timing and availability. As a marketer of power-related goods and services, understanding the waiting and approval process is essential for long-term success.
FERC, ISOs/RTOs, and the Queue Process
The Federal Energy Regulatory Commission (FERC) is the entity in charge of regulating access to the U.S. power wholesale market. This market is open to utility-owned suppliers as well as independent power producers (IPPs). Seven regions geographically divide the market made up of Independent System Operators (ISOs) and Regional Transmission Organizations (RTO) that include the entire U.S. and Alberta, Canada.
The ISOs and RTOs are the following:
- ISO NE - New England
- CAISO - California Independent System Operator
- MISO - Midcontinent Independent System Operator
- NYISO - New York ISO
- PJM - PJM Interconnection
- SPP - Southwest Power Pool Interconnection
- AESO - Alberta Electric System Operator
The ISOs and RTOs serve multiple functions. These functions include ensuring the needs of locations and timelines for new transmission facilities, overseeing the balance of generation and load within the interconnections, and the connection of new utility-scale power generation projects to the power transmission grid.
Approval for interconnection is a process that leads to the interconnection agreement followed by the subsequent interconnection request and study phases. This process depends on the customer satisfying various ISO requirements, including the signing of contracts, installation of metering, etc. This process may seem daunting and it varies with each authority.
FirmoGraphs is currently refining a waiting process data program as an extension of our Power Mart subscription service. This will allow us to improve our approach with input from existing customers, and our Business Intelligence (BI) observations show the following benefits:
Waiting List Timing and Your Business

Different parts of the power industry value chain are interested in projects at various points during the waiting process. For example:
- Consulting firms that provide study-related services to assist interconnection customers comply with the utility procedures,
- Organizations selling equipment and construction needed during project realization would want to become involved in the middle to the end of approval, and
- Environmental management organizations interested in siting and permitting.
Interest in the waiting timeline is highly business-dependent. Whichever aspect of the power market you serve, it is essential to have a good handle on each of the regional ISO waiting times where you are interested in the business.
Observations on Queue Timelines
Developers can expect long wait times once a project is uploaded to the respective interconnection queue. The average timeline is 4.6 years, while a maximum period of 16 years and a minimum waiting period of just three months. These stats are output from our initial queue analysis and will be revised as we continue data gathering.
The barriers and obstacles that lead to extended waiting periods include, but are not limited to, the following:
- ISO review paper applications which may lead to delays,
- The size of the project in MW capacity,
- ISOs requirements, distinct by region,
- Projects dependent on the structure of the market, and
- Established priorities of existing projects in the queue.
The Big Picture: Solar Projects Dominate
Although the federal renewable energy subsidies and tax credits have been declining for solar, the number of projects in the interconnection waiting list is still growing.
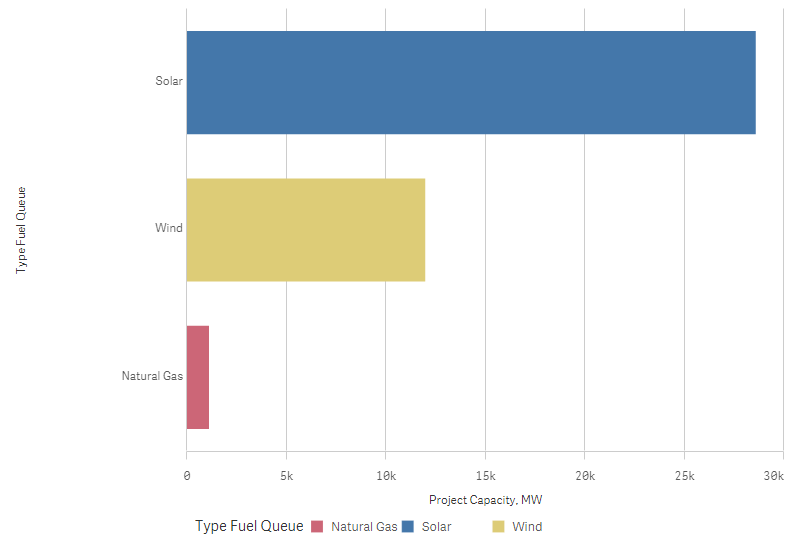
The below chart confirms the popularity and the increase of solar projects in the interconnection queue, followed by natural gas and wind. Across the US, suppliers and independent producers have been working to add solar energy amounting to more than 28,000 MW. This is the equivalent of providing electricity to more than 4.5 million homes1.
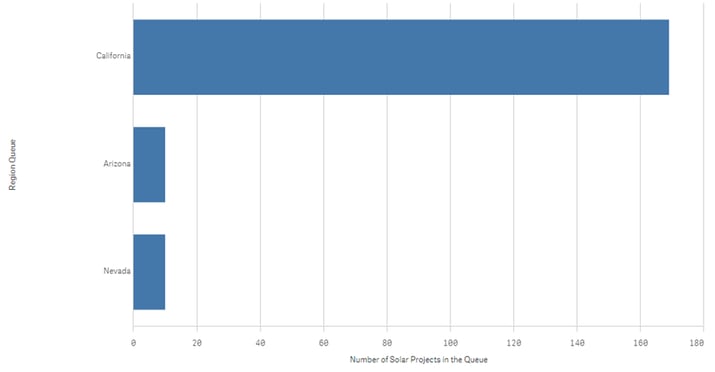
The number of solar power projects dominates the interconnection queues in the US. Aas of mid 2019, the following chart shows the Top-3 States of solar power projects which are in the queue. The top state is California. The Wind Solar alliance published a follow-up report on the quantification of benefits of renewable energy reforms that it proposed in 2018, estimating that the aggregate benefits were in the range of $2.5 to $6.9 billion for consumers. This is a signal for more renewable projects entering the regional queues.
 Looking again at all fuels including planned energy storage, the following chart highlights the top-3 States based on the total MW. The highest planned cumulative queues are in California, followed by the states of Minnesota and Iowa.
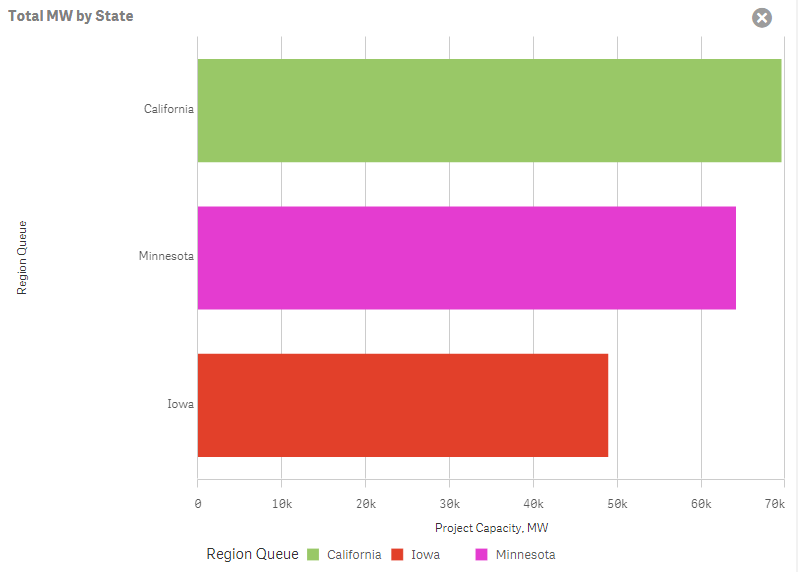
We’ve done some rationalizing across the different queue formats for the 7 ISOs and RTOs to arrive at these numbers. These numbers are shared as indicative of trends and are not absolutes.
Call for Action: Use Queue Data in Your Business Development Efforts
FirmoGraphs, through the application of effective Business Intelligence, provides actionable insights to help you efficiently assess the time to reach project leads in the interconnection queue. Contact us to evaluate how ISO, RTO, and FERC insights can be valuable in your own business development efforts.
-------
1On the assumption that 1MW provides power to 164 homes
22018 Wind Solar Alliance report Customer Focused and Clean: Power Markets for the Future.
Our favored BI solution, Qlik Sense™ Enterprise, makes mashing-up multiple data sets fun and easy. Our customers find new opportunities to grow revenue, and reduce risk, by combining the Water Mart with their own proprietary CRM and market data.
Disclaimer
None of the information we provide may be taken as legal advice. Please consult an attorney if you require a legal interpretation of this information.
Any information contained on this website or within any attachments is offered without representation or warranty as to its accuracy or completeness and FirmoGraphs, LLC cannot be held responsible for loss or damage caused by errors, omission, misprints or your misinterpretation of such information. Seek competent professional advice prior to relying on or utilizing such information in any manner as any such use is at your own risk.

