Water, water, everywhere. Especially in blogs by companies with large environmental services practices.
That’s what Samuel Taylor Coleridge’s ancient mariner might have said if he, like a few resolute FirmoGraphs staffers, had analyzed blogs published during the first 6 months of 2021, by the 243 companies that made ENR’s Top 200 Environmental Firms in 2020, 2019 and 2018. When we searched those blogs to see how often they mentioned water, we found it flowed into around 3,720 paragraphs of blogs by 149 companies, more than 17,370 times.
Why We Looked at Blogs
The idea of a metablog, or a blog o' blogs, is to help our customers with their inbound marketing. As defined by HubSpot, which specializes in it, inbound marketing is "a business methodology that attracts customers by creating valuable content and experiences tailored to them." Our customers invest heavily in content meant to engage their customers by providing them with useful information, and blogs make up a large chunk of that content.
In blogging, as in other aspects of life, to become the "pack leader," it helps to benchmark what the "pack" is doing. To help FirmoGraphs customers who blog do that, we counted and categorized the most popular terms among blog posts. Our scope included all posts listed in the blog, news, press release, and insights sections of the organizations we reviewed. We also included posts longer than 50 words on the organization's home pages. We gathered all written, video, and audio posts. No sampling exercise will ever be 100% complete, but we believe we captured over 98% of posts, excluding Posts from other social media accounts such as Twitter or LinkedIn were excluded.
Writing is hard work, particularly for busy engineering and construction subject matter experts. Most engineers don't wake in the morning and say, "I feel like blogging today." Therefore blogging is a purposeful activity, and seeing what your competition is posting about can provide a window into their marketing tactics and strategies, as well as give you some ideas for yours.
Hot Blogging Terms
If the theory we espoused in the preceding paragraph is correct, these companies are strongly focused on marketing related to drinking water, transportation infrastructure, PFAS, and solar projects. Those are some of the terms that appeared frequently in the 6,170 blogs we analyzed, which were written by 207 of the 243 organizations we tracked.
As we noted earlier, water was the most popular term of the ones we looked at, getting mentioned by 149 organizations over 17,370 times in around 3,720 paragraphs of the blogs we analyzed.
PFAS, which engineering firms are tasked with removing from water, turned up roughly 2,300 times in 936 paragraphs written by 49 companies, confirming our decision that they were important enough for us to write a blog about them.
Infrastructure also was a popular term, showing up more than 5,500 times in over 3,110 paragraphs written by more than 140 companies in their blogs. FirmoGraphs anticipates that number being even larger in the second half of the year due to the infrastructure bill that recently passed the Senate, which we also wrote a blog about.
Solar, as in energy, power, panels, projects, etc., was a hot topic, too, showing up 1,410 times in 815 paragraphs in blogs by 78 different organizations. In fact, we at Firmographs thought it was such a hot topic that we decided to write a blog about it ourselves.
Blog Breakdown
For our analysis, we divided blog posts into four categories.
- Qualifications and Staffing posts deal with the capabilities of a firm and/or individual staffers, as well as hires, promotions, and other personnel changes, typically without deep discussion.
- News posts include any type of news about a firm, including M&A, awards, and events.
- Projects posts primarily are about projects done for customers, who usually are identified, but may also mention news or provide some insights.
- Insights posts may mention news or projects but are more in-depth looks at one or more topics that highlight a firm’s subject-matter expertise.

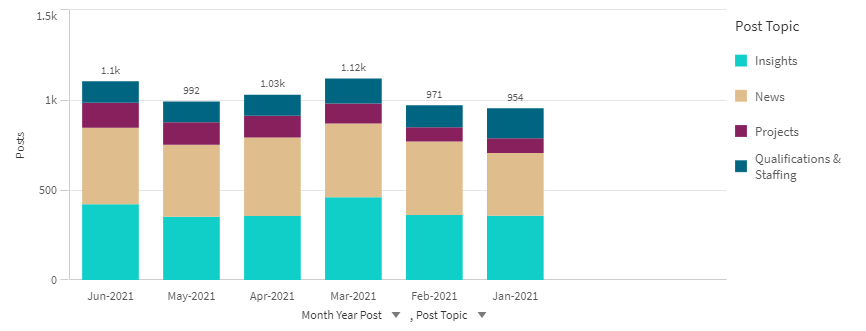
Of the blog posts we analyzed in the first half of the year, we found that:
- 39.3% (2426) were News;
- 37.4% (2306) were Insights;
- 12.6% (780) were Qualifications & Staffing; and
- 10.7% (658) were Projects.
None of those results is surprising. Blogs are an excellent vehicle for companies to communicate news about themselves and demonstrate their knowledge by offering insights about what’s happening in their industries. It makes sense that more than three-quarters (76.7%) of the blog posts we analyzed were News or Insights. Unless it’s not routine — either because it involves major certifications or executive changes — news about qualifications and staffing often isn’t worth blogging about, which likely explains why it was a focus of only about 13% of the blog posts we analyzed. As for projects, even the firms capable of simultaneously working on a large number of them don’t finish one that often, which is probably why they focused on only about 11% of the blog posts we analyzed.
We also categorized posts based on their media and found that only 23 were Audio, 127 were Video and 6020 were Written. The large number of Written posts is not surprising, but the small number of Audio ones is. It could be because most things in-depth enough to merit an Audio post also have components that are worth presenting as charts/diagrams, artistic renderings, and/or photographs, in which case they need to be Written posts, or as videos, in which case they may as well be Video posts, which sometimes are referred to as vlogs.
Who is Blogging
To see who, and who isn’t, writing blogs, FirmoGraphs divided the companies we looked at into four groups based on the annual revenue of their environmental practices.
|
Group |
Annual revenue |
Number of companies |
Number of blog posts |
|
1 |
$0 to $100 million |
81 |
1,616 |
|
2 |
$100 to $250 million |
37 |
1,018 |
|
3 |
$250 million to $1 billion |
31 |
1,502 |
|
4 |
> $1 billion |
13 |
1,210 |
We then looked to see who the busiest bloggers were in each group.
In Group 1 ($0-$100 million), Dewberry with 94 posts, AKRF, Inc. (85) and VHB (81) were among the most frequent posters. The average company did about 20 posts and the median number of posts for the group was 15.
In Group 2 ($100-200 million), Trinity Consultants, Inc., with 162 posts, Haskell (120) and SCS Engineering (89) were the most prolific bloggers. This group’s average number of posts was 27.6 and its median number of posts was 20.
The most frequent posters in Group 3 ($250 million-$1 billion) were SNC-Lavalin (137), ICF (128) and Leidos. (122). Its average number of posts was nearly 48.5 and its median number of posts was 41
Group 4 (> $1 billion) only had 13 companies, none of which had fewer than 37 posts. Stantec (277), HDR (154) and Jacobs(129) posted most often. The average number of posts for the group was 93 and the median number of posts for the group was 74.
Generally, this data suggests that bigger firms blog more than smaller ones, which is no surprise as they have more to blog about and more people to blog for them. It also suggests that the bigger firms think blogging is worthwhile — they wouldn’t be doing it otherwise — which indicates that it’s likely worthwhile for smaller firms to do, too, and it’s worthwhile for us to track.
Use Cases for the Blog o’ Blogs
We are only able to scratch the surface here, on this Blog o’ Blogs. All told, across the 6,170 1st half blogs, there are approximately 83,300 paragraphs.
All of these paragraphs are now housed within our natural-language text-analytics database. From there, we can generate deeper analysis, such as word clouds and topic cluster analysis.
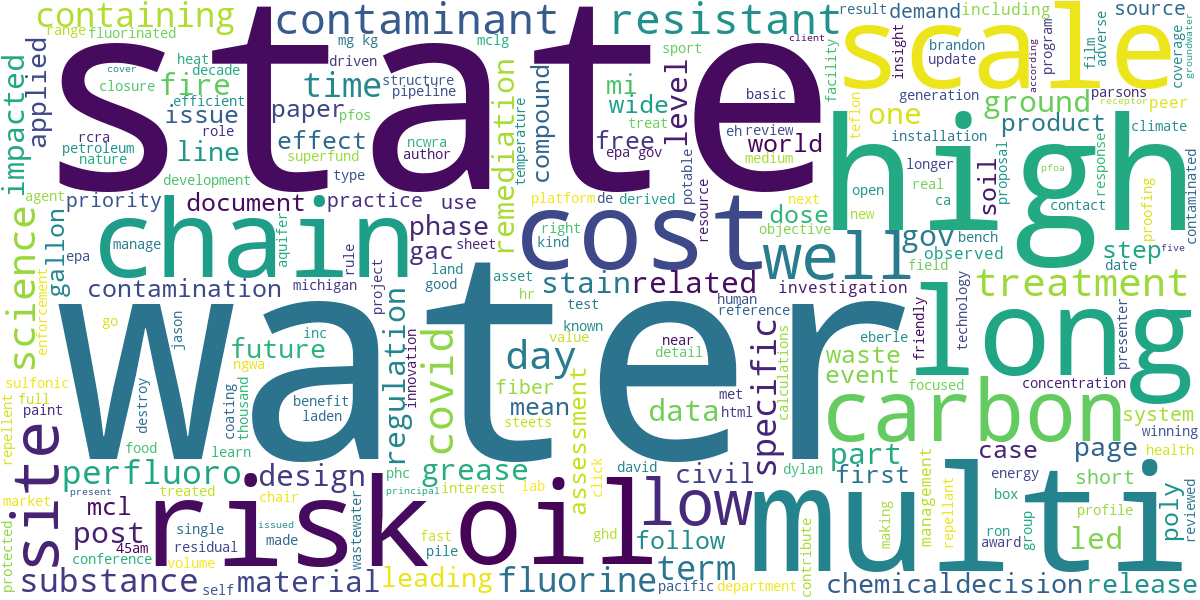
Here is an example of a word cloud for PFAS. It shows the most prevalent words in blogs that mention PFAS, once the term “PFAS” and common terms such as “an” and “the” are removed. The larger the word, the more frequently the word is used.

Cluster analysis help us look at the context in which certain terms like PFAS are used. We found that PFAS was most-often discussed in the context of sampling projects, treatment projects, and environmental regulation.
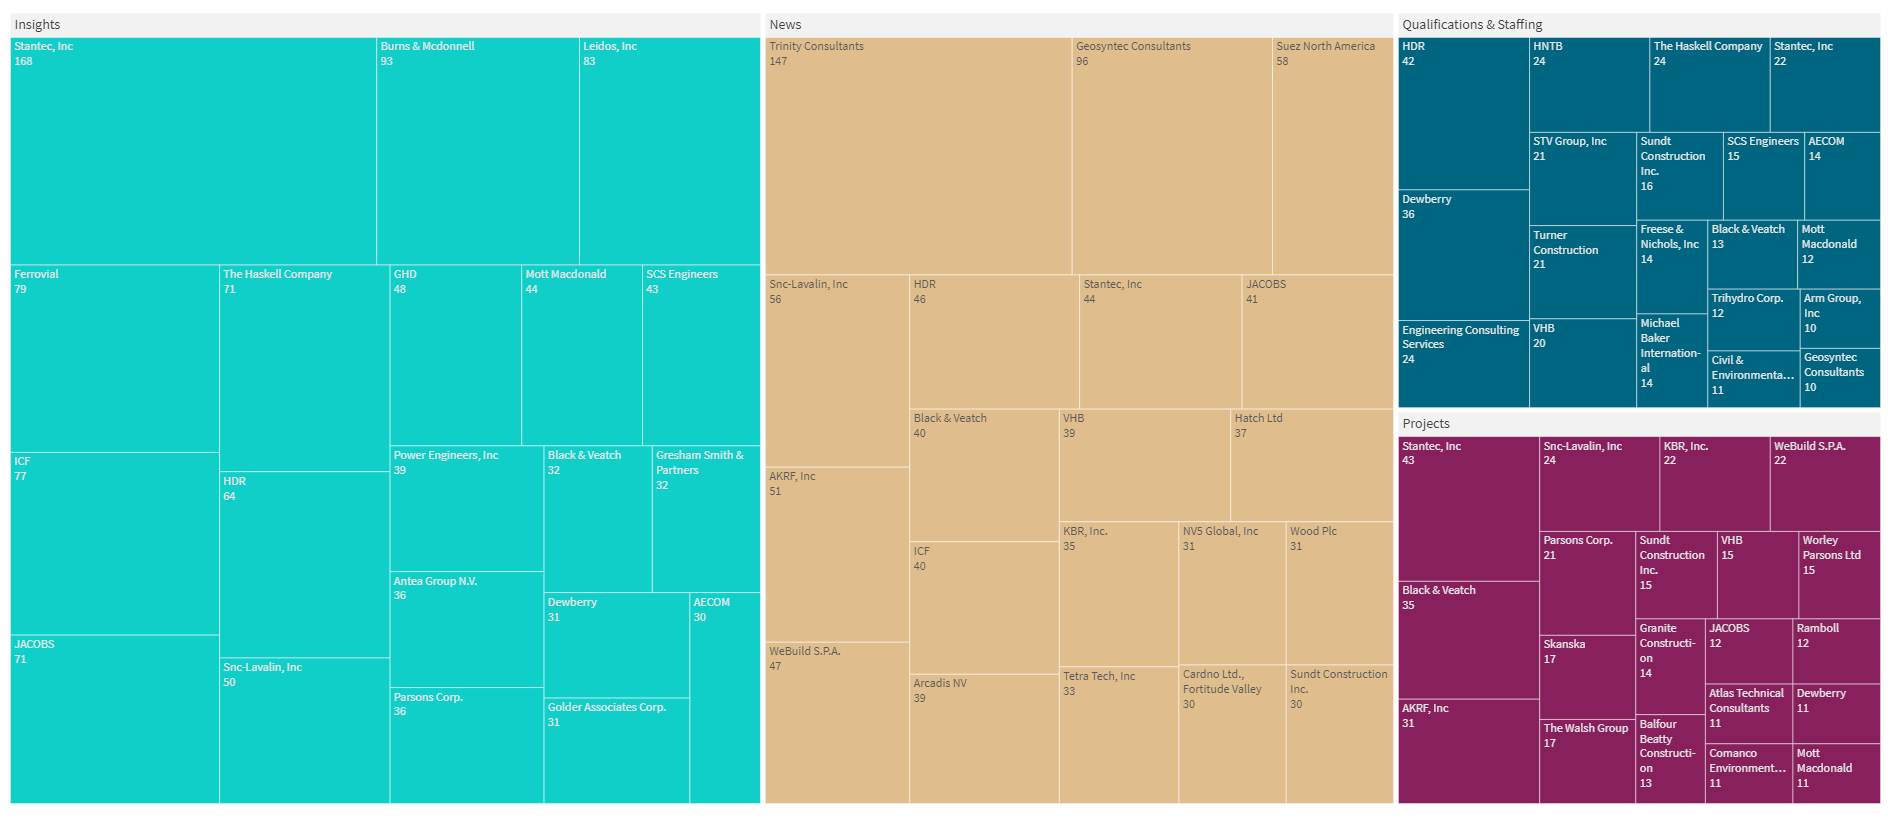
Our preferred business intelligence tool, Qlik Sense, allows us to create dozens of different visualization types, such as the following tree map that shows the Top 10 blog contributors in our 4 categories.

(This copy is a little difficult to read, but we will gladly share a bigger picture when we meet.)
Strategic planners can use this data to learn how their competitors are positioning themselves in the market. Market leaders can use it to evaluate how their inbound content marketing strategies stack up against the competition. Proactive companies of all sizes can use business intelligence from our blog data set to benchmark themselves against their competition and get the most from their marketing investments.
Let’s Meet
If you are interested in learning more about the Blog o’ Blogs, and its rich underlying data set, let’s meet! We can help you put the data to work.
As a business intelligence firm, FirmoGraphs continuously monitors and records the topics and trends that top environmental engineering organizations are focusing on. We collect the data and then analyze it to produce information of interest to our customers. If you think we could help your company, feel free to request a meeting and review the data live in our business intelligence platform.


