Hello Readers!
As you know, the power generation mix in the U.S. fleet has been undergoing important changes. As a power industry service provider and marketer, it is important to note and assess the overall power generation resources mix for a better understanding of the U.S Power Industry.
Thinking About the U.S. Power Fleet
Let’s start with the definition of ‘Nameplate Capacity’. Power generation plants are assigned a Nameplate Capacity which is also known as the nominal capacity or maximum effect. The Nameplate Capacity represents the total output of a power generation plant, ideally, over some specified time period. It is commonly stated in MWs (Megawatts). For most technologies – fossil fuels, geothermal or nuclear generation, the nameplate capacity can be estimated on the basis of the system’s engineering. However, for solar and wind power, the overall estimate may vary based on operating decisions.
We derive most of our base information from data published by the EIA. These are some of the most-important EIA data sources:
- The EIA survey Form EIA-860 gathers specific information related to operational and planned generators along with related equipment that operates at power plants with 1 MW or greater nameplate capacity.
- The EIA survey Form EIA-923 collects in-depth data related to electricity generation on a monthly and annual basis - fossil fuel stocks, fuel consumption and different receipts at prime mover level and power plants.
In addition to publishing raw data, the EIA also publishes useful monthly and annual analysis. For example:
- Energy consumption data
- Average Sale (retail) prices
- State and Federal energy development in the U.S
These data sources can be very useful when you are projecting your own business in the U.S. power market.
Added Power Generation Capacity
With the Business Intelligence software from Qlik populated with data, we can let look at new generation capacity that has been onboarded in the past 10 years.
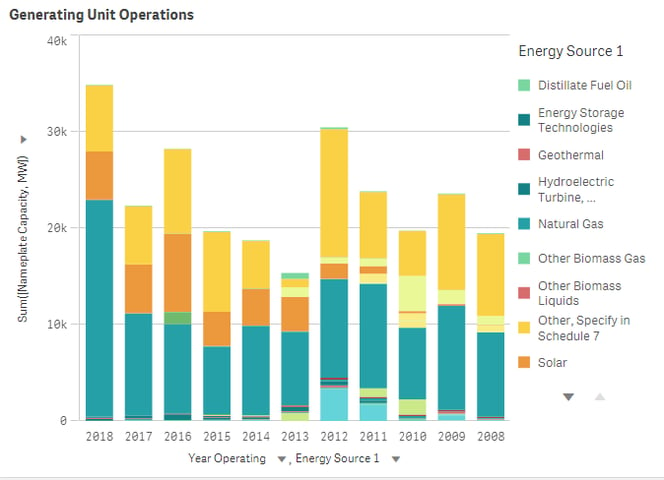
- Renewables - wind and solar, have been added as shown here, have experienced a significant increase in their share of power generation mix, especially in the last few years. You can see that the count of units is very high because the average nameplate capacity tends to be much lower than traditional fossil-generated energy.
- From a fossil energy perspective, note that no coal power generation units have been added in the last 10 years. However, natural gas has experienced a significant boost in terms of becoming the most utilized source as power generation.
- Virtually no nuclear capacity has been added in the last several years, with the last plant commissioned in June 2016 - Unit 2 Tennessee Watts Bar.
Retired Power Generation Capacity
Next, consider what has been retired.
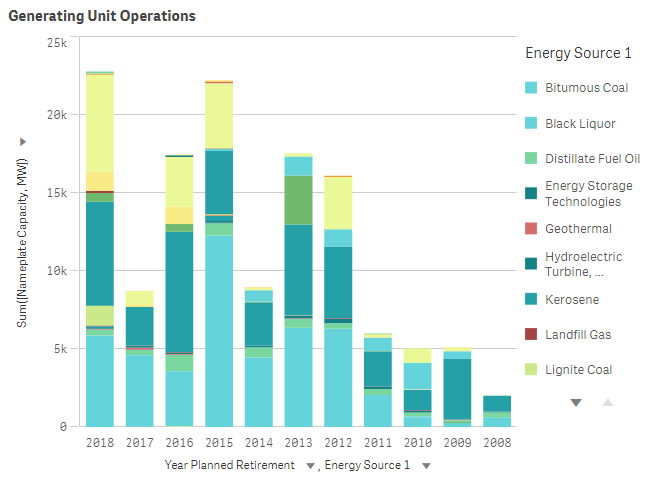
- Coal plants have been retiring and will continue to do so. From the year 2010 till the start of 2019, 100s of coal power units have been retired.
- Gas plants have been increasing mainly due to higher efficiency.
- Some renewable power capacity is also retiring, however, the projection by EIA assumes an overall increase in power generation from renewables.
Most of the utility-level power plants retired in the U.S during the period of 2008 and 2017, were fossil fuel power plants. According to NARUC (National Association of Regulatory Utility Commissioners), coal power plant life span averages around 40 years.
As reported by the U.S EIA, 47% of coal power plants and 26% of natural gas generation capacity was retired. Most of the projected retirements of power generation by 2020 are the ones that use coal or natural gas as a resource. More than 70% of the coal power plants operating in the U.S are over 30 years old.
Conclusion
As you serve your electric utility market customers, it is important to anticipate:
- The retirement of older generation units, and how that changes the entire supply chain for design and construction services, equipment, production and transportation of fuels, and decommissioning
- The market shift from coal to renewables including solar and wind, with those related opportunities for project siting, permitting, construction, and maintenance
- New market opportunities particularly relating to storage technologies and transmission projects, to accommodate the irregular and distributed production of solar and wind energy
Moreover, you need to be well aware and foresighted with respect to state and federal lawmaking. For example, ‘How will power generation projects in a state be affected by the new laws and regulation?’ or ‘What new business opportunities may be arising?’
To avail yourself of opportunity arising from the changing dynamics of the market, it is critical to analyze these market shifts at a tactical level. Our analysis and insights take into consideration the micro and macro level market indicators and KPIs. Through the application of effective business intelligence, we provide actionable, decision making information to help you efficiently assess and succeed in the growing industry of power generation.
Our favored BI solution, Qlik Sense™ Enterprise, makes mashing-up multiple data sets fun and easy. Our customers find new opportunities to grow revenue, and reduce risk, by combining the Water Mart with their own proprietary CRM and market data.
Disclaimer
None of the information we provide may be taken as legal advice. Please consult an attorney if you require a legal interpretation of this information.
Any information contained on this website or within any attachments is offered without representation or warranty as to its accuracy or completeness and FirmoGraphs, LLC cannot be held responsible for loss or damage caused by errors, omission, misprints or your misinterpretation of such information. Seek competent professional advice prior to relying on or utilizing such information in any manner as any such use is at your own risk.


