US industry continues to have a substantial reporting burden. As a company serving US industry, the details matter! Whether you are providing reporting services to industry, or solutions for increased efficiency and reduced operating cost, it is worthwhile to look at
GHG emissions and how they are reported.

Each spring, facilities that emit above 25,000 metric tons of CO2e (see Wikipedia) of GHGs must report their emissions under the US EPA Greenhouse Gas Reporting Program (GHGRP). According to the EPA, this covers roughly half of total U.S. emissions. The remainder are primarily related to fossil fuel consumption, for example in car and truck transportation.
We’ve found that there are 3000+ organizations, averaging 2.5 sites each, who reported in 2016 covering more than 280 NAICS industries. Reported emissions to the EPA are around 3 billion tonnes per year. To put this in perspective:
-
3 billion tonnes is about 6.6 trillion pounds
-
20 lbs of CO2 would fill 1200 gallon jugs
-
If we were filling milk jugs with our reported CO2e, it would fill around 330 billion gallon milk jugs per year.
The way reporting works, the burden of reporting is not proportional to emissions. If you have a lot of sites exceeding the threshold, you may be reporting for many sites, even if your total emissions are well below the biggest emitters.
-
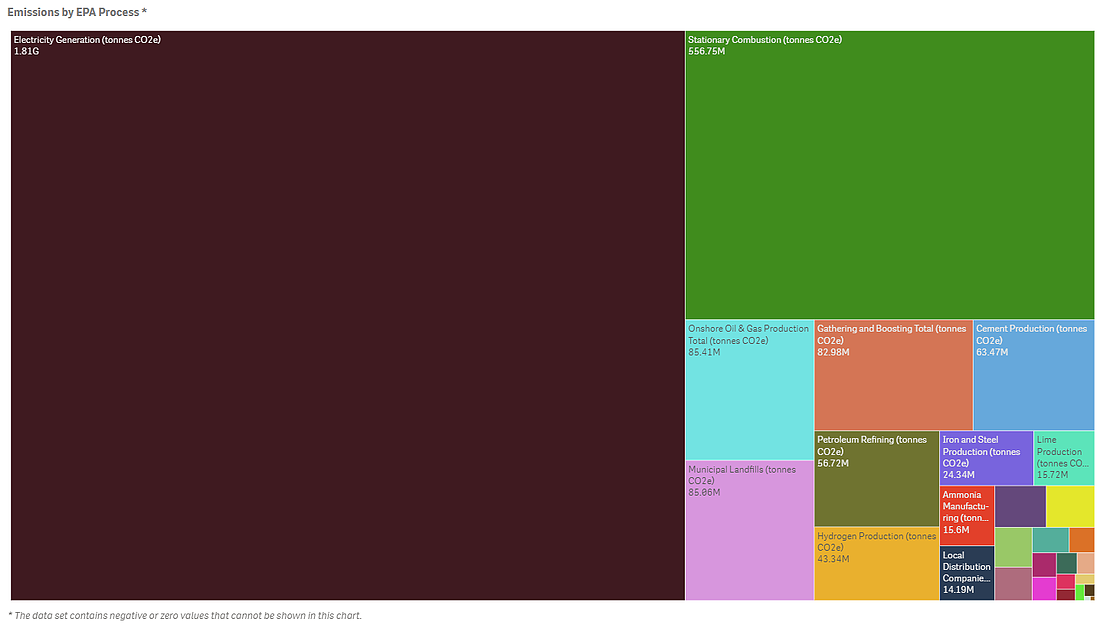
The largest emitters by tonnes are, not surprisingly, fossil-fueled electric power generators. Electricity generation contributed more than 1.8 billion tonnes, more than 60%, of the total.
-
The most-burdened reporters by site count include the country's largest municipal waste management companies, as well as pipeline, and upstream / midstream oil and gas companies. The top 50 reporting organizations range from a high of 216 to a low of 25 sites.
Figure: Emissions by Process, 2016 GHGRP Data
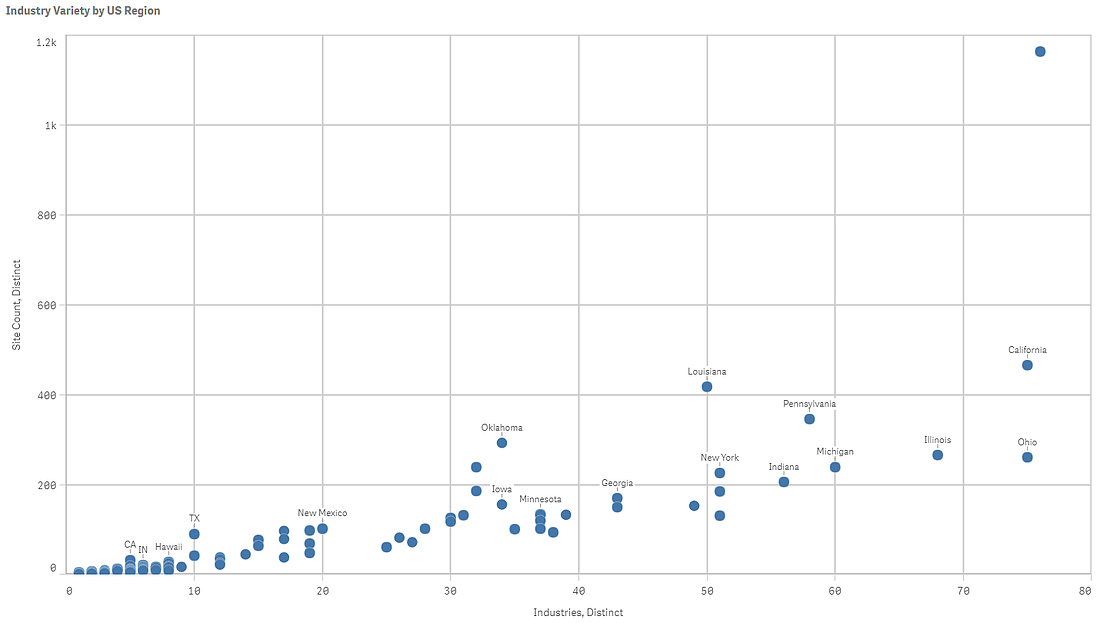
It is interesting to look at site count, and it isn’t surprising that Texas tops the charts as the state with the largest number of sites, and greatest variety of industry types reporting.
Figure: GHG Reporting Sites by Industry, State
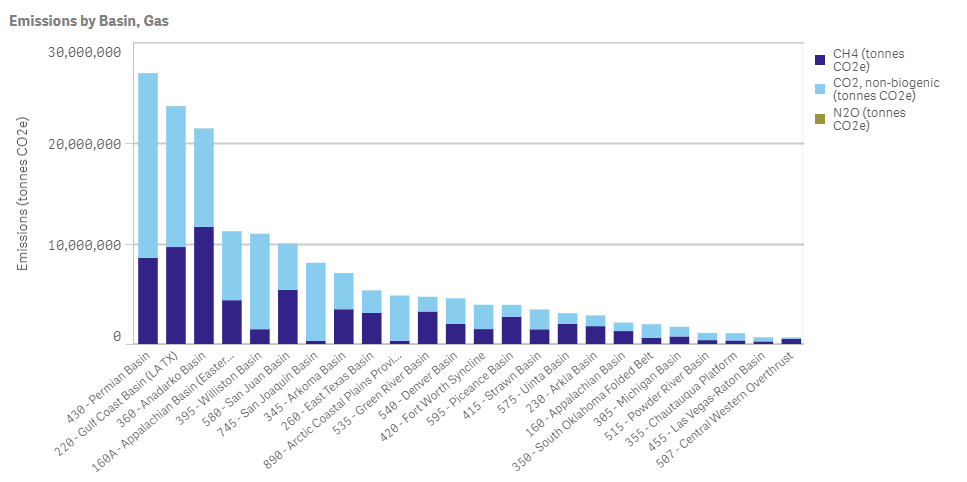
Within geographic boundaries such as oil and gas production basins, or otherwise comparable peer groups, there is an opportunity to benchmark. Companies such as Huco Consulting are starting to offer these services to existing customers with similar types of operations.
Figure: 2016 Reported Emissions by Basin
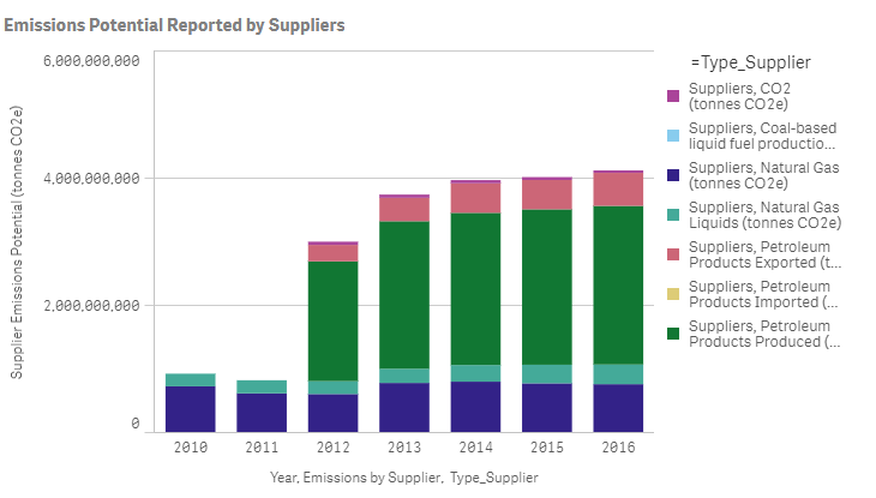
The GHGRP is dynamic, in that there have been at least minor revisions each year since reporting started in 2010. This can make multi-year comparisons interesting, since many emission values are calculated and not directly measured. For example, the rules governing “emissions potential” reported by suppliers of materials such as petroleum products, have changed such that reported amounts increased dramatically in 2012.
Figure: GHGRP Supplier-Related Emissions
Companies that deploy an Environmental Management Information System (EMIS), such as the software-as-a-service (SaaS) offering from Enviance can enjoy a significant benefit when it comes to reporting time each year. These systems can also provide advantages when it comes to change management, particularly for organizations that have a lot of M&A activity, since asset data is time and date-stamped along with inevitably changing calculation methodologies.
There is much more knowledge to be gleaned from this data in combination with other data sets. FirmoGraphs curates a normalized version of this data as 1 of dozens of regulatory-related data sets. This way, you can leverage this Data Mart along with others (think financial, site permitting) to generate your own unique observations for the US industrial market. Our favored BI solution, Qlik Sense™ Enterprise, makes mashing-up multiple data sets fun and easy.
Click here to learn how to develop better relationships with your US Utility Market customers. Link to Pillar Page.
Firmographs closely follow the GHG Emissions index. Click here to learn more.
Click below to download our E-Book with 5 Critical Actions for Insight-Driven Marketing.

You might also want to read our blog FirmoGraphs Climate Mart 2019 Release.
Disclaimer
None of the information we provide may be taken as legal advice. Please consult an attorney if you require a legal interpretation of this information.
Any information contained on this website or within any attachments is offered without representation or warranty as to its accuracy or completeness and FirmoGraphs, LLC cannot be held responsible for loss or damage caused by errors, omission, misprints or your misinterpretation of such information. Seek competent professional advice prior to relying on or utilizing such information in any manner as any such use is at your own risk.


