The infrastructure bill recently signed into law by President Biden will authorize $1.2 trillion in federal spending, including $550 billion in new spending, over 5 years. Of that, $272 billion is transportation spending, broken down as follows:
- Roads, bridges and major infrastructure projects — $110 billion
- Passenger and freight rail — $66 billion
- Public transit — $39 billion
- Airports — $25 billion
- Port infrastructure — $17 billion
- Zero and low-emission buses and ferries — $7.5 billion
- EV chargers — $7.5 billion
That will provide a wealth of contracting opportunities for transportation infrastructure companies. And if you’re a business development professional for one of those companies, we at FirmoGraphs can help you find the opportunities that make the most sense for your firm to bid on. We’re able to do that because we maintain a database of projects sourced from documents that state departments of transportation are required to issue in order to receive federal funding.
STIP Right Up
The documents are called Statewide Transportation Improvement Programs, or STIPs. The Federal Transit Administration defines a STIP as “a staged, multi-year, statewide intermodal program of transportation projects, consistent with the statewide transportation plan and planning processes …”
States are federally mandated to develop STIPs in cooperation with the local and regional organizations within their borders that do transportation planning, such as Metropolitan Planning Organizations, Regional Transportation Planning Organizations, and public transit authorities. The FTA has a description of STIPs and the processes that states must follow to put them together. Additionally, STIPs typically contain descriptions of the process used by the state departments of transportation issuing them.
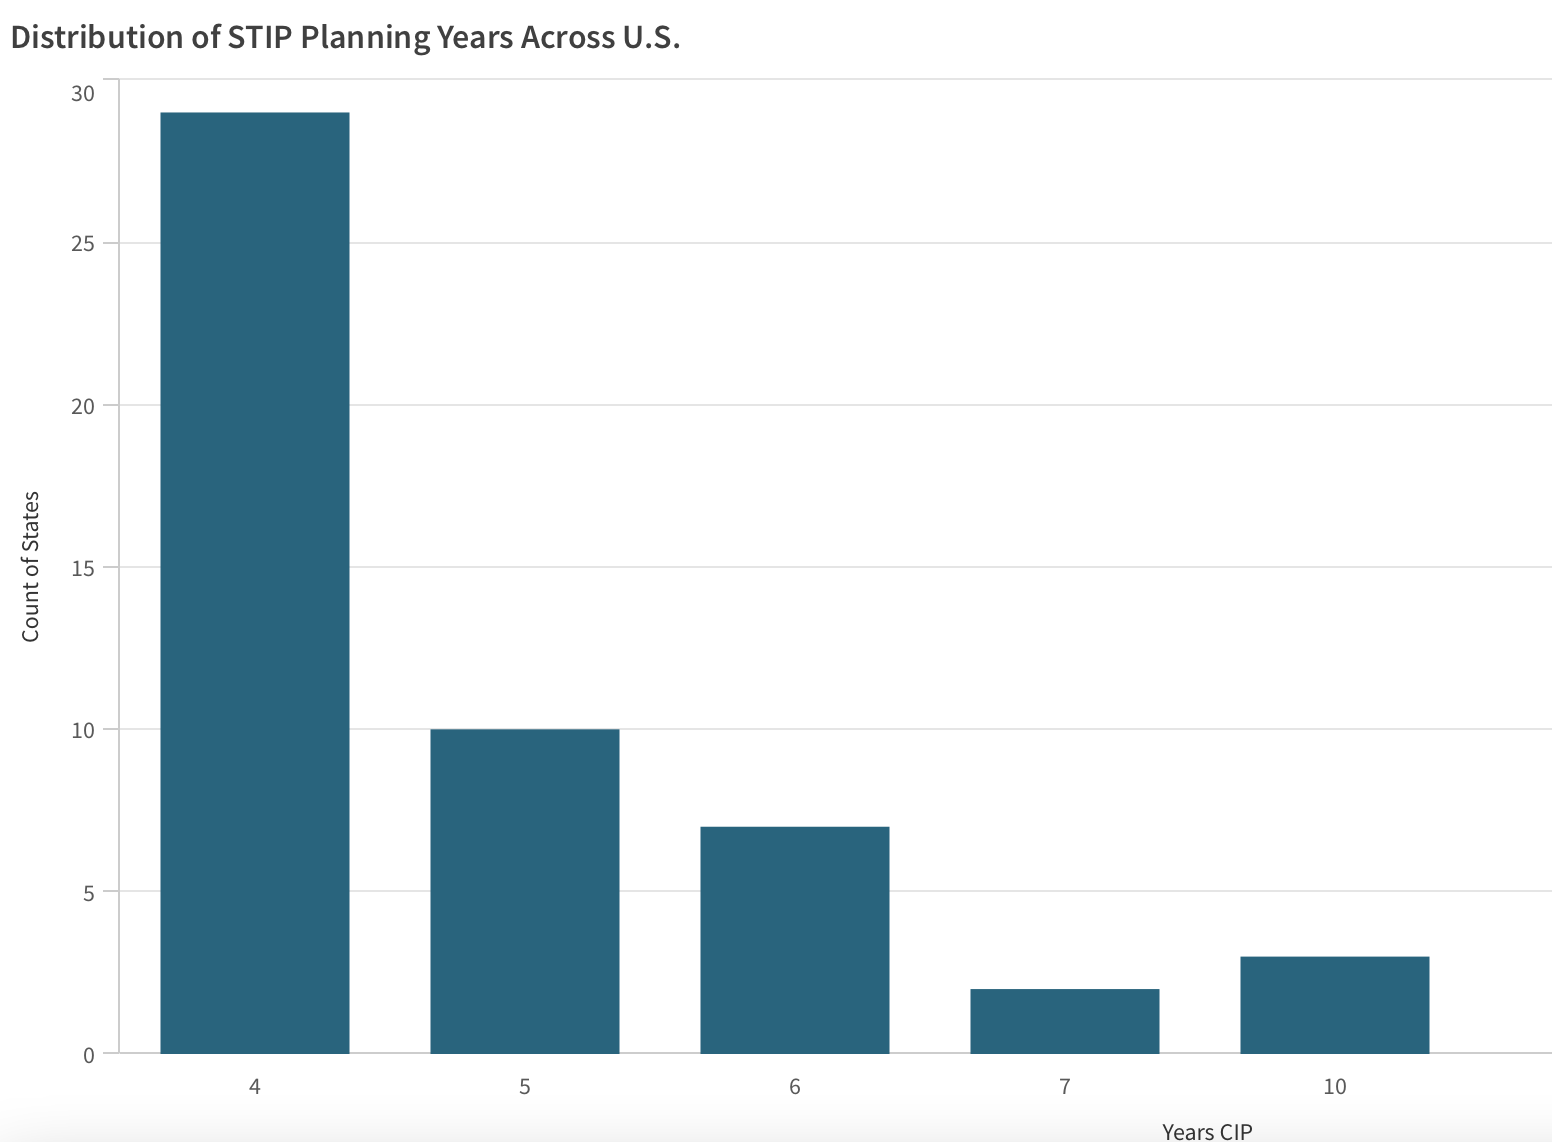
STIPs are required to cover periods of at least 4 years and be updated at least that often. While a few states have STIPs as long as 10 years, most keep them to 4 years, as the bar chart below shows. How frequently states update their STIPs depends in part on how much work they do on their transportation infrastructure. New York, for example, last approved its most recent STIP, which covers the 2019-2023 federal fiscal years, in October 2019, but it makes information on the projects in its STIP available for download on a monthly basis.
Keeping current on that information is difficult, which is why we’re happy to do it for you. But even breaking down STIPs that aren’t updated that frequently can be a daunting task. For example, the Ohio Department of Transportation’s STIP for fiscal years 2021-2024, which was put out in May 2020, is 2,512 pages, including a 1,971-page appendix consisting of a list of highway projects that is not exactly beach reading.
In addition to helping business development people identify specific projects that suit their company, we can use our database to make other observations about current and planned spending on transportation projects in the U.S.
Hey, Big Spenders
For example, just looking at the projects contained in the STIPs covering fiscal years 2021-2024, we can see that California is planning to do the most transportation spending over that time frame — nearly $72.5 billion. Florida ($39.1 billion) is a distant second, followed by Texas ($28.8 billion). After that, there are 8 states planning to spend more than $10 billion on projects, ranging from North Carolina ($17.4 billion) to Ohio ($11.5 billion). You can see that in the treemap below, which represents the size of each state by the value of the projects in its 2021-2024 STIPs.
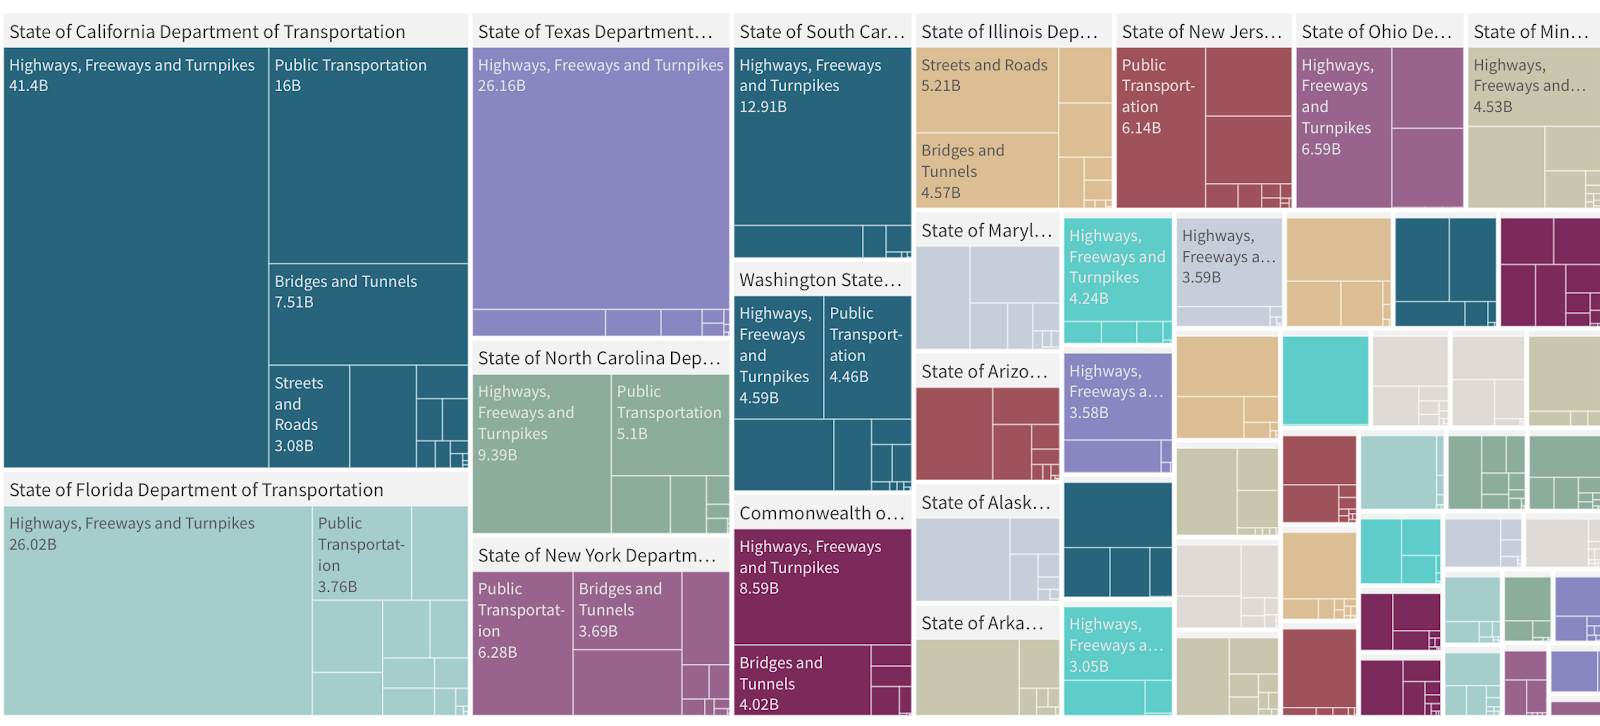
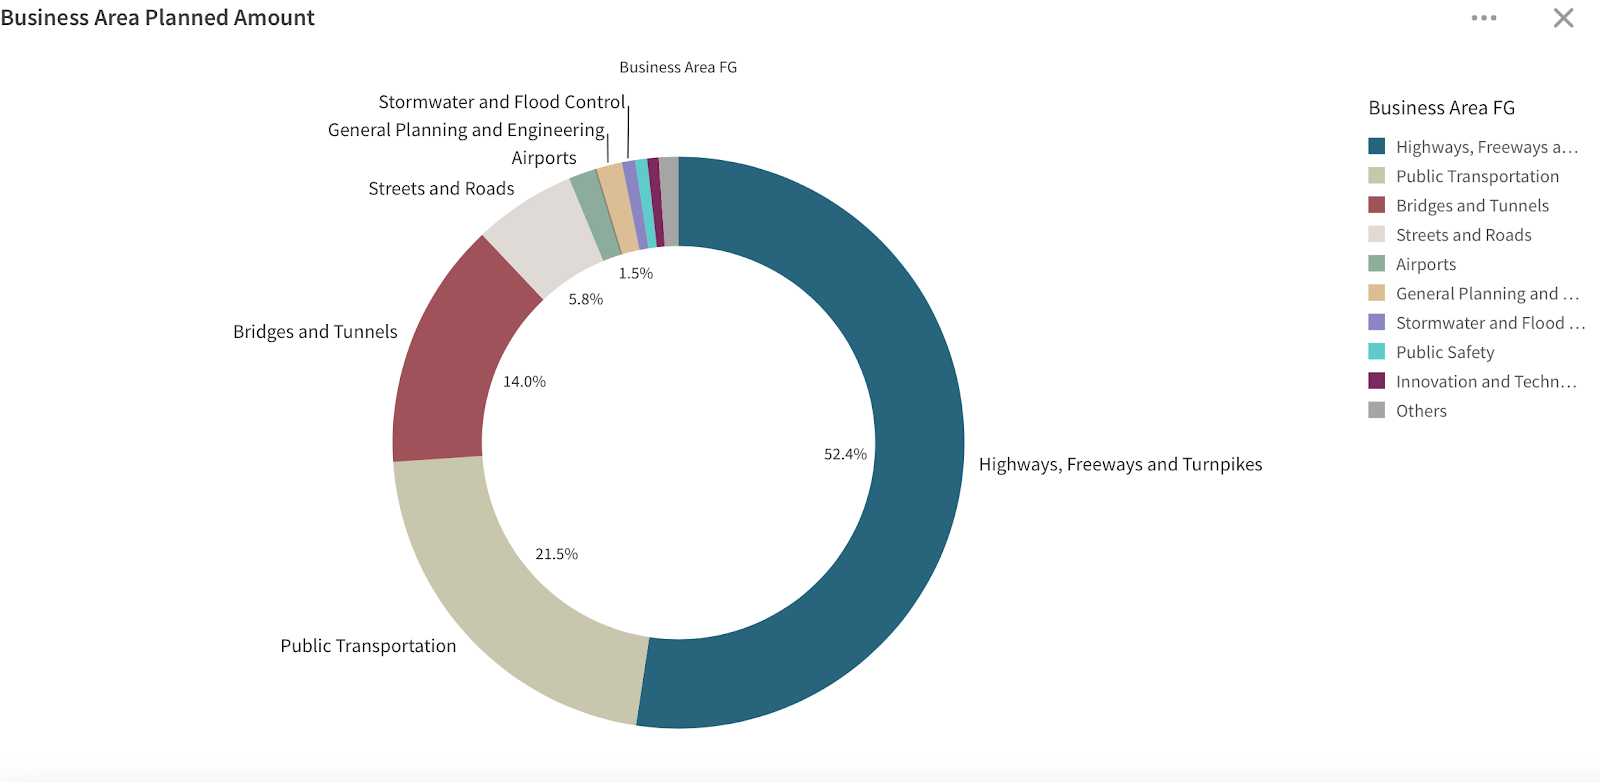
The treemap also shows the value of each state’s projects according to their business area, which is our categorization of projects by type. We have 18 business areas. The top five by the value of the projects in them are “Highways, Freeways and Turnpikes” ($309.1 billion); “Public Transportation” ($127.1 billion); “Bridges and Tunnels” ($82.8 billion); “Streets and Roads” ($34.2 billion); and “Airports” ($9.2 billion). Below is a graphic showing all the projects in all the STIPs in our database according to their business area. Some of the print may be difficult to read but we can show you larger versions in our business intelligence platform. (Also, please ignore the dots and the “x” in the upper right-hand corner.)
Another way we categorize projects is by phase. For example, if a department of transportation says it expects to be acquiring rights of way for a project in a specific fiscal year, we’d classify the project as being in the “Right of Way” phase that year. (Obviously, DOTs can, and often do, plan to complete more than one phase of a project in a year.) Other phases include “Planning and Design,” “Purchasing” and “Construction,” the last of which is the phase with the most money allocated to it in all the STIPs in our database ($371.5 billion).
Projects, Projects Everywhere
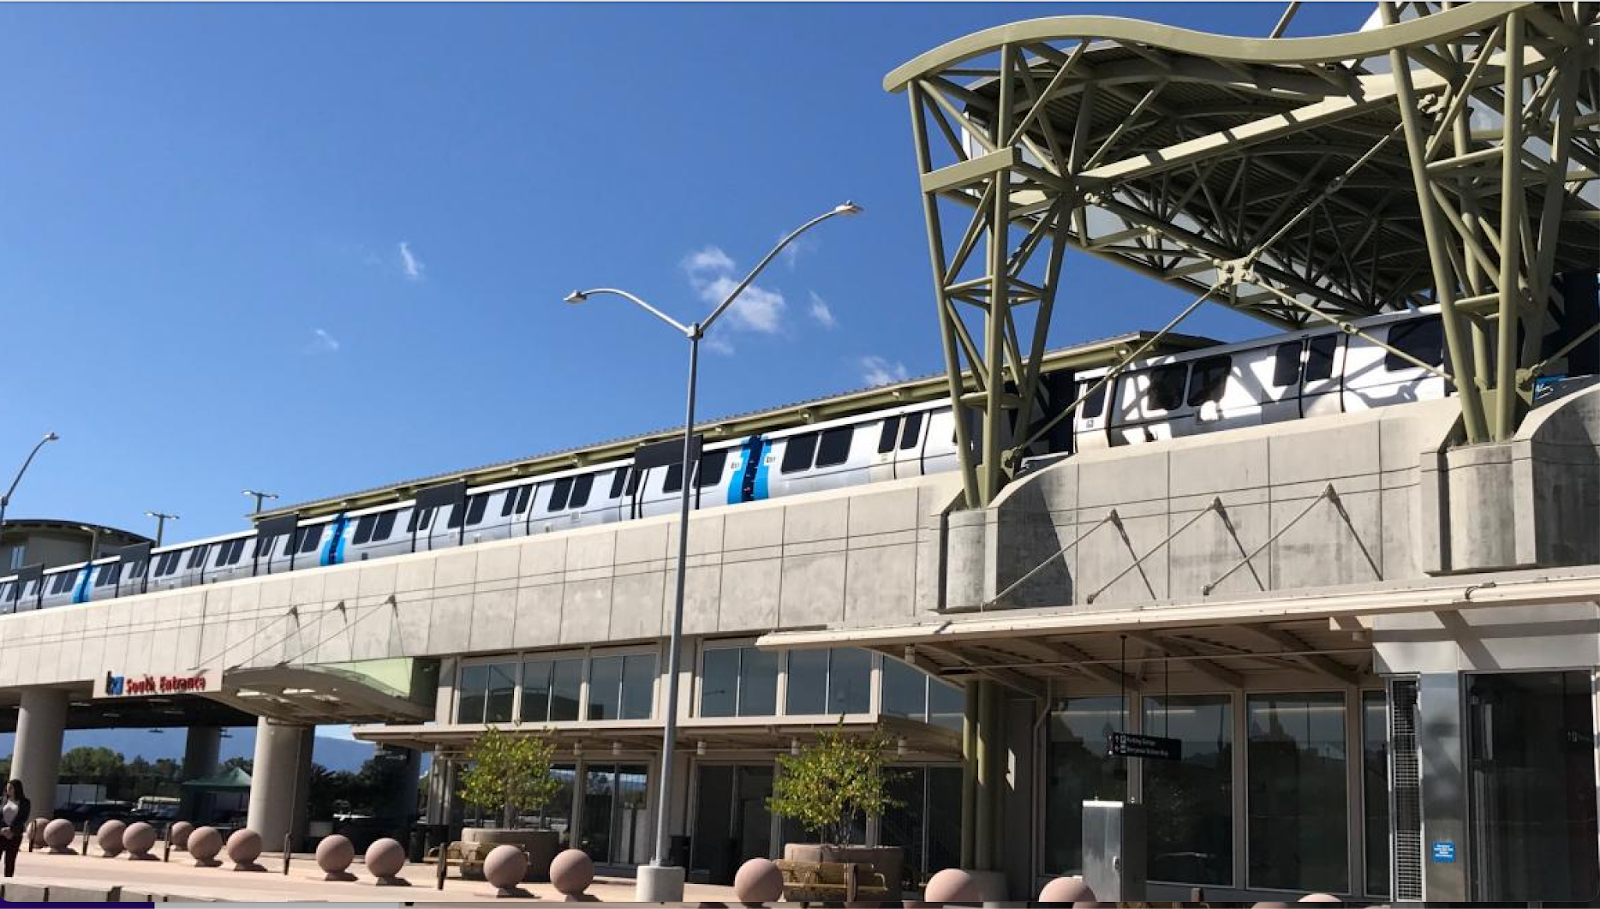
In all, the STIPs in our database contain a little more than 70,000 projects with a total value of around $580 billion, meaning the average project has a value of about $8.4 million. Of the 10 projects with the highest value, only 3 are highway projects; the remaining 7 involve public transportation. Of those, 4 are in California’s Bay Area, including the 2 largest — a $4.78 billion extension of the Bay Area Rapid Transit system, which will bring trains like the one shown below into Silicon Valley; and Phase 2 of the Transbay Transit Center Program, which will cost $4.25 billion, and involves a rail line extension, two train stations, a bus station, and a pedestrian corridor, all in San Francisco.
The most expensive highway project is actually a program, which is true of a number of items classified as projects in STIPs. The South Carolina Department of Transportation plans to spend $3.6 billion on statewide operations and maintenance, including operations and maintenance houses, in its fiscal years 2021-27. The second most expensive highway project is a $3.55 billion addition of commercial vehicle lanes to a stretch of I-75 in Georgia.
Let Us Help
As we said earlier, if you’re a business development professional with a transportation infrastructure company, FirmoGraphs can use our STIP database to help you find the projects that make the most sense for your company to bid on. If you’re interested in seeing how, feel free to request a meeting and review our data live in our business intelligence platform.

