The $1 trillion infrastructure bill that was passed by the Senate last month promises to result in a wealth of opportunities for FirmoGraphs customers if it becomes law.
In the meantime, however, a bill that became law in March is already presenting opportunities for FirmoGraphs customers in the water, wastewater, and broadband infrastructure spaces.
Overview
The American Rescue Plan Act of 2021, also known as ARPA, authorized $1.9 trillion in funding to help the economy recover from the COVID-19 pandemic. It is best known for having enabled roughly 170 million Americans so far to get a $1,400 check from the federal government, but it also established the Coronavirus State Fiscal Recovery Fund and the Coronavirus Local Fiscal Recovery Fund to provide $350 billion in emergency funding to eligible state, local, tribal, and tribal governments.
Governments that receive money from the funds can use it to support public health; address economic harm done by the pandemic; replace public sector revenue lost due to the pandemic; provide premium pay to essential workers; and, most importantly for FirmoGraphs customers, invest in water, sewer, and broadband infrastructure.
Money from the funds is being allocated in the following manner:
- States and the District of Columbia — $195.3 billion
- Counties — $65.1 billion
- Metropolitan cities — $45.57 billion
- Tribal governments — $20 billion
- Non-entitlement units (NEUs) of local government — $19.53 billion
- Territories — $4.5 billion
That means many FirmoGraphs customers could be able to pursue opportunities at three levels (state, county and city or NEU); some could pursue them at four if they do business in areas with Native American tribes; and some could even pursue them at five if they also service U.S. territories.
Distribution Timing
The Treasury Department is distributing money from the funds directly to states, counties, metropolitan cities, tribal governments, and territories. For NEUs, which are cities, villages, towns, and townships with populations of less than 50,000, the department is distributing money from the funds to the states, which will then pass it on to the NEUs. (The Treasury Department’s breakdown of ARPA can be found here.)
Most entities are getting money from the funds in two tranches with only territorial governments receiving a single payment. States that saw their unemployment rise more than 2 percentage points between February 20 and the date they were certified to receive their money are getting it in one payment; the rest are getting it in two equal tranches. As of August 20, the Treasury Department had determined that 31 states either will receive their money in two tranches or would receive it in two tranches based on the August 20 unemployment data. A list of the states and whether they will or would get their ARPA money in one or two tranches can be found here.
Local governments (i.e., counties, metropolitan cities and NEUs) were to have gotten half their money in May and are to get the rest around next May. Tribes were to have received the first of two payments in May and the second in June, although as the second was based on employment data, they had to supply that to the Treasury Department first.
Entities receiving ARPA money must allocate it by the end of 2024 and spend it by the end of 2026.
Distribution Method
The Treasury Department’s method of allocating the money from the funds varies according to the entities that are receiving it.
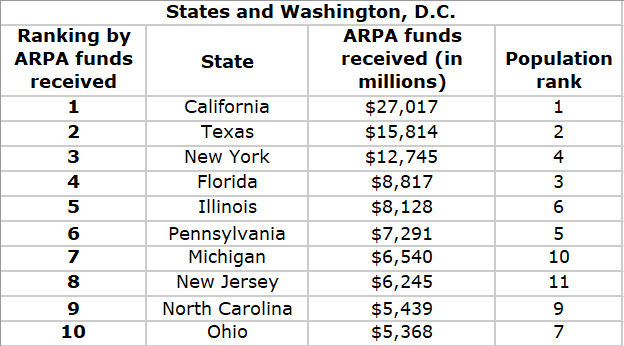
Of the $195.3 billion going to the states and District of Columbia, $25.5 billion is being split equally among them. Washington, D.C., also is receiving an extra $754.9 million for reasons not worth explaining here. The remainder is being distributed according to a formula that takes into account the number of seasonally adjusted unemployed people in each state and the district during the three-month period ending December 20, 2020. The result is that the ranking of states by the total amount of money they received is the same as their ranking due to the amount of money they received as a result of the number of seasonally adjusted unemployed people they contained and differs somewhat from their ranking by population, as the table above shows.
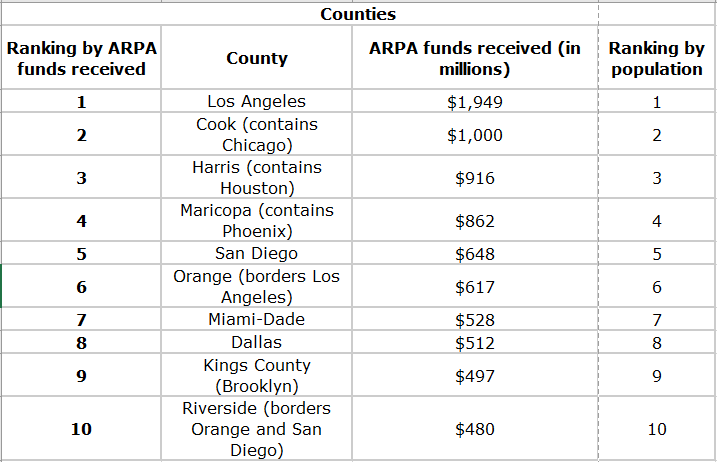
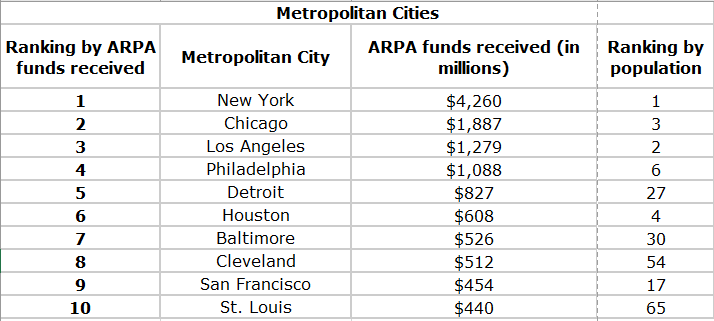
The $65.1 billion that counties are to receive is being distributed according to their populations and the Community Development Block Grant formula found in the Housing and Community Development Act of 1974, the latter of which also is being used to determine how the $45.57 billion earmarked for metropolitan cities is being distributed.
The first table above shows that the use of the CDBG formula didn’t have much of an impact on how much ARPA money the nation’s 10 largest counties got, as their rankings by ARPA money received are the same as their rankings by population. It did, however, have a huge impact on how much money the metropolitan cities received, as the second table above shows. (Metropolitan cities are either the central cities in their metropolitan areas or cities with populations ≥ 50,000.)
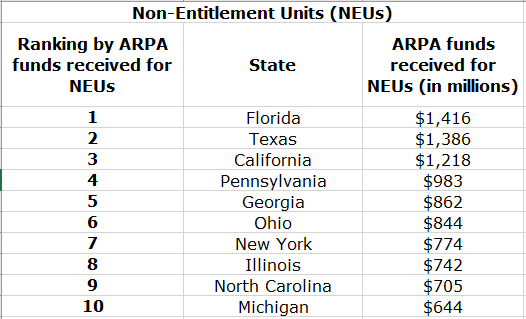
The $19.53 billion going to NEUs is being allocated to states based on the populations of their NEUs. The table above shows the states that are the top 10 recipients of ARPA money for their NEUs.
Total Funding by State
This treemap chart shows the states and Washington, D.C., in sizes proportionate to the ARPA money that they, their counties, metropolitan cities and NEUs received.
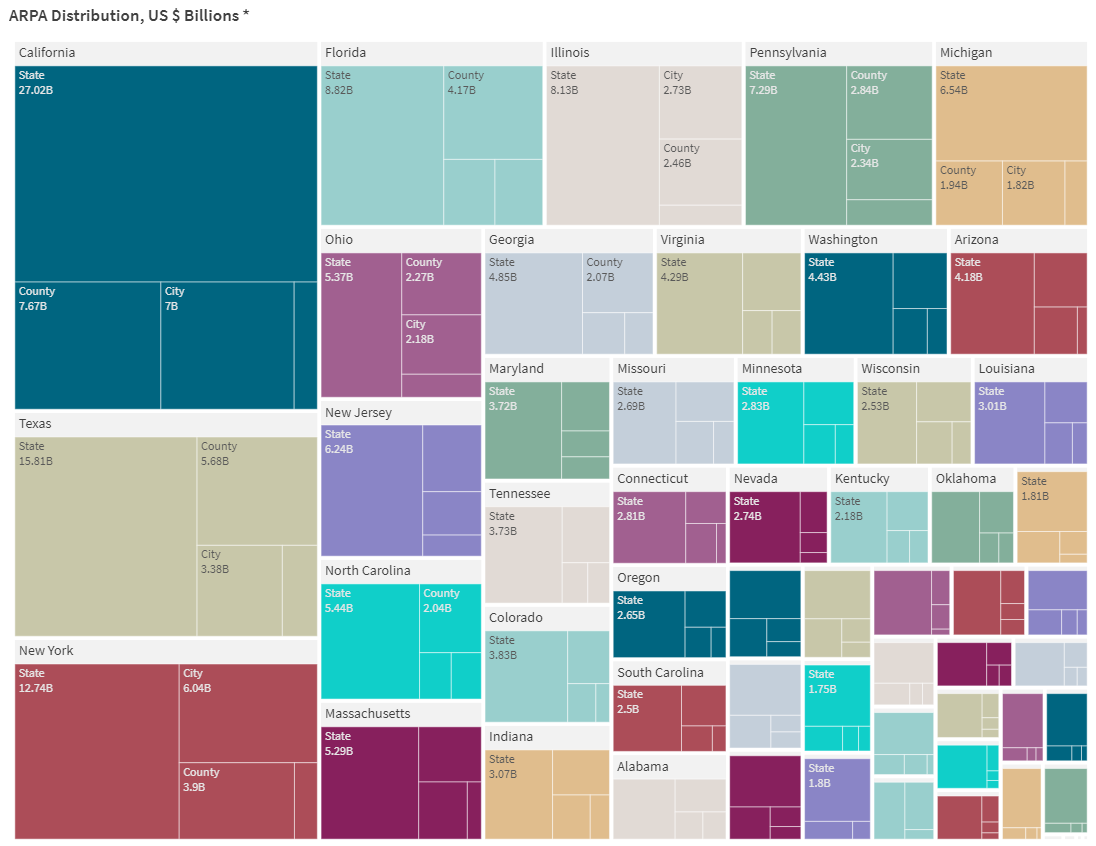
(This copy is a little difficult to read, but we will gladly share a bigger picture when we meet.)
Tribes and Territories
The Treasury Department is distributing $1 billion equally among all tribal governments, with 65% of the remainder being distributed according to how many people are enrolled in each tribe and 35% being distributed according to employment data.
Half of the $4.5 billion going to territories will be distributed equally among the territories and the other half will be allocated by population.
State Impact of ARPA Funds
To measure the potential impact of ARPA money on each state, the Pew Charitable Trusts’ state fiscal health initiative calculated state allocations as a percentage of state budgets and showed the results as a map. That measure, which only uses money allocated to the states themselves, not money allocated to their cities or counties that they will pass through to their NEUs, produced the following rankings:
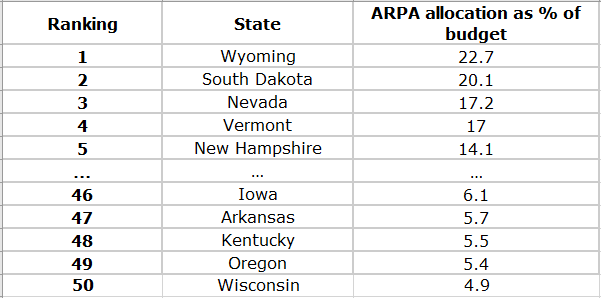
Source: The Pew Charitable Trusts
There are no surprises among the top five. All have small populations and therefore small budgets, so the ARPA money they receive will amount to a large percentage of their budgets. The fact that Texas, which isn’t shown, ranks sixth with its ARPA money equaling 12.2 percent of its budget is surprising, as it’s the second-most populous state. The bottom five states all rank between 21st (Wisconsin) and 33rd (Arkansas) in population, which probably is because the states that got the most money have large budgets.
Tracking State ARPA Spending
Knowing what government entities have gotten, are getting or will get ARPA funding is important, but what’s more important for FirmoGraphs’ customers is figuring out the projects they will use the money to fund.
A good place to start is by seeing how the states, which are getting the largest chunk of the ARPA money, are allocating it.
As of July 15, most states had received the first half of their ARPA money and a small number had received all of it, according to a report by Drexel University’s Nowak Metro Finance Lab. The report said most of the states were using a regular budget process to allocate their money, six had set up a smaller advisory group and Wisconsin was having its governor do the allocation.
Twenty-six states have fully or partially appropriated their ARPA money, incorporating part of it into their 2022 fiscal budgets and leaving the rest to be appropriated in future legislative sessions, according to the report. The amount they’ve appropriated ranges from nearly 100% (Indiana) to 0.5% (Maine). The remaining 24 states likely will appropriate the money in upcoming special or regular legislative sessions, according to the report.
At least two states so far have made sizable appropriations to water and sewer infrastructure. The report said Montana allocated $462.7 million, or 51% of its initial ARPA allocation, and Kentucky allocated $250 million (11%).
Finding out how a state plans to spend its ARPA money can be difficult. The report said many states have put their allocations in their normal budgets, which makes them hard to track. To speed the process, the National Conference of State Legislatures has created a tool for tracking ARPA allocations by state.
Tracking Local ARPA Spending
Following what local governments are doing with ARPA money appears to be easier. Counties seem to be doing a good job of announcing the process by which they’re determining how to spend their ARPA money, with many getting their residents involved. That’s also true of at least some metropolitan cities. Money going to NEUs can be tracked at two levels, as states are announcing distributions of it and many NEUs, like counties and metropolitan cities, are keeping their residents informed and often seeking their input on how best to spend the ARPA money they receive.
How FirmoGraphs Can Help
So what should FirmoGraphs clients do? Monitor the websites of counties and towns with which you have done business or want to do business, as well as the websites of the media that cover them, such as local newspapers and TV and radio stations. That can give you an idea of how much ARPA money your current and potential customers are getting and how much they’re allocating to water and wastewater projects.
From there, we can help you identify the projects they’re most likely to spend their ARPA money on. We’ve curated data on hundreds of thousands of capital projects from government agencies across the country and can handily sort these with you to see which should be high priorities for your business. By working with us, you’ll be in a great position to have educated conversations with the agencies you’ve targeted, showing that you’ve studied their needs.
Feel free to request a meeting and review the data live in our business intelligence software system!